Dashboards
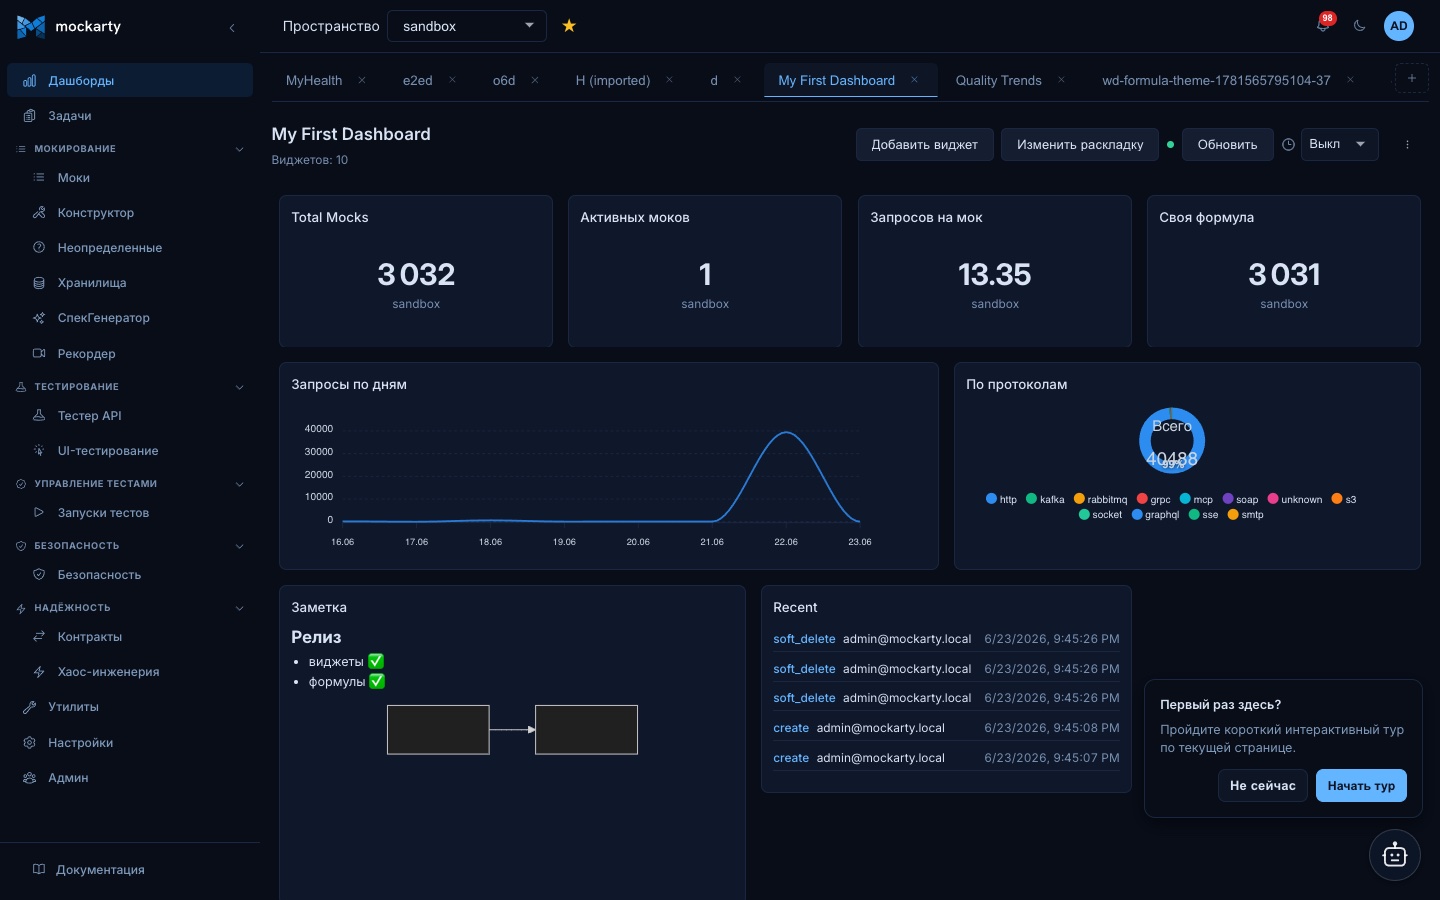
Dashboards let you build your own monitoring pages from ready-made widgets:
mock traffic counters, test-case statistics, fuzzing findings, chaos experiment status,
recent audit activity and more. Each dashboard is a free-form 12-column grid — drag,
resize and pin widgets until the page shows exactly what your team needs.
About URLs in examples: all examples use
localhost:5770as the default Mockarty address. If your instance runs on a remote server, replacelocalhost:5770with its actual address (e.g.https://mockarty.company.com). See Tips & Useful Features for details.
Where to find it
Open Dashboards in the sidebar, or go to /ui/widget-dashboards.
Clicking a dashboard opens it at /ui/widget-dashboards/<id>. The legacy
/ui/dashboards URL redirects here.
An empty namespace offers a one-click Starter dashboard — a ready-made
overview (traffic, protocols, test-run error rate, top mocks, recent activity)
you can then tune to your team.
Dashboards are namespace-scoped: each dashboard belongs to one namespace, and the
namespace switcher at the top of the page changes which dashboards you see.
While a namespace or dashboard is loading, its previous cards are hidden. If the
list cannot be loaded, the page shows Failed to load dashboards with a Retry
button. This is a loading error; it does not mean your dashboards were deleted.
If the Add widget catalog fails to load, its picker stays open and offers
Retry there as well.
On first open, a new namespace receives editable starter dashboards, including
Deployments. It shows deployment runs by current state for the last 30 days,
the number of runs that need attention, available runners, and webhook delivery
status. The attention count includes older unresolved runs and rollbacks that
have not been verified yet. Deployment data sources are available only on
namespace dashboards; shared dashboards cannot
aggregate deployment records across namespaces.
The starter set also includes Deploys — an operator view of the durable
deploy ledger written by the autonomous-coder deploy pipeline: outcomes for the
period (succeeded / failed / rolled back), p50 and p95 deploy duration, and the
latest deploys with their per-run outcome. Like the Deployments board, the
deploy sources are namespace-only.
The deploy ledger records deploys performed by the autonomous coder. Without
that module in your licence the Deploys widgets are hidden from the picker,
and the seeded board is created without them.
Who can do what
| Action | Who |
|---|---|
| View dashboards and widget data | Any member of the namespace |
| Create / edit / delete dashboards and widgets | Namespace owner, or a global admin / support user |
| Create / edit / delete shared (global) dashboards | System admin / support only |
A user with the viewer role in a namespace can open and read every dashboard in it,
but any attempt to change something is refused with 403.
Creating a dashboard
- Open
/ui/widget-dashboardsand click New dashboard. - Enter a name (required, up to 200 characters, unique within the namespace) and an
optional description. - The empty dashboard opens in edit mode — add your first widget.
You can also duplicate an existing dashboard: the copy gets a new name you choose
and carries over all widgets with their settings and layout.
Shared (global) dashboards
A regular dashboard shows the data of one namespace. A shared dashboard
aggregates data across every namespace of the instance — the company-wide
view: total mock traffic, test cases by priority, fuzzing findings by severity,
the whole runner fleet.
How it works:
- A shared dashboard lives in the default namespace (
sandbox) — the one every
user can open — so everyone in the company sees it there. Its tab carries a
globe icon, and the toolbar shows the All namespaces badge. - Only a system admin or support user can create or modify a shared
dashboard. For everyone else it is read-only: the edit controls are hidden,
and direct API writes answer403. - To create one, open New dashboard in the default namespace and tick
Shared dashboard (across all namespaces) — the checkbox is visible to
admins and support only. Via the API, pass"scope": "global"in the create
body; outside the default namespace the request is refused with400. - Because every user can see a shared dashboard, only privacy-safe data
sources are allowed on it — aggregates that carry no resource names, ids,
e-mail addresses, namespace names or free-form labels. The widget picker
hides incompatible sources, and the API refuses them with400. The catalog
marks each source with aglobalSafeflag. An existing shared widget that
uses such a source shows an unavailable-data error until you replace it.
A formula on a shared dashboard can use only operands that are also allowed
on shared dashboards; older formulas with incompatible operands show an
unavailable-data error.
Existing dashboards are not affected: everything created before stays
namespace-scoped.
# Create a shared dashboard (admin/support token, default namespace)
curl -X POST -H "X-API-Key: $TOKEN" -H "Content-Type: application/json" \
  -d '{"name": "Company overview", "scope": "global"}' \
  "http://localhost:5770/api/v1/widget-dashboards?namespace=sandbox"
Adding widgets
Click Add widget and pick a data source from the catalog. Each widget combines:
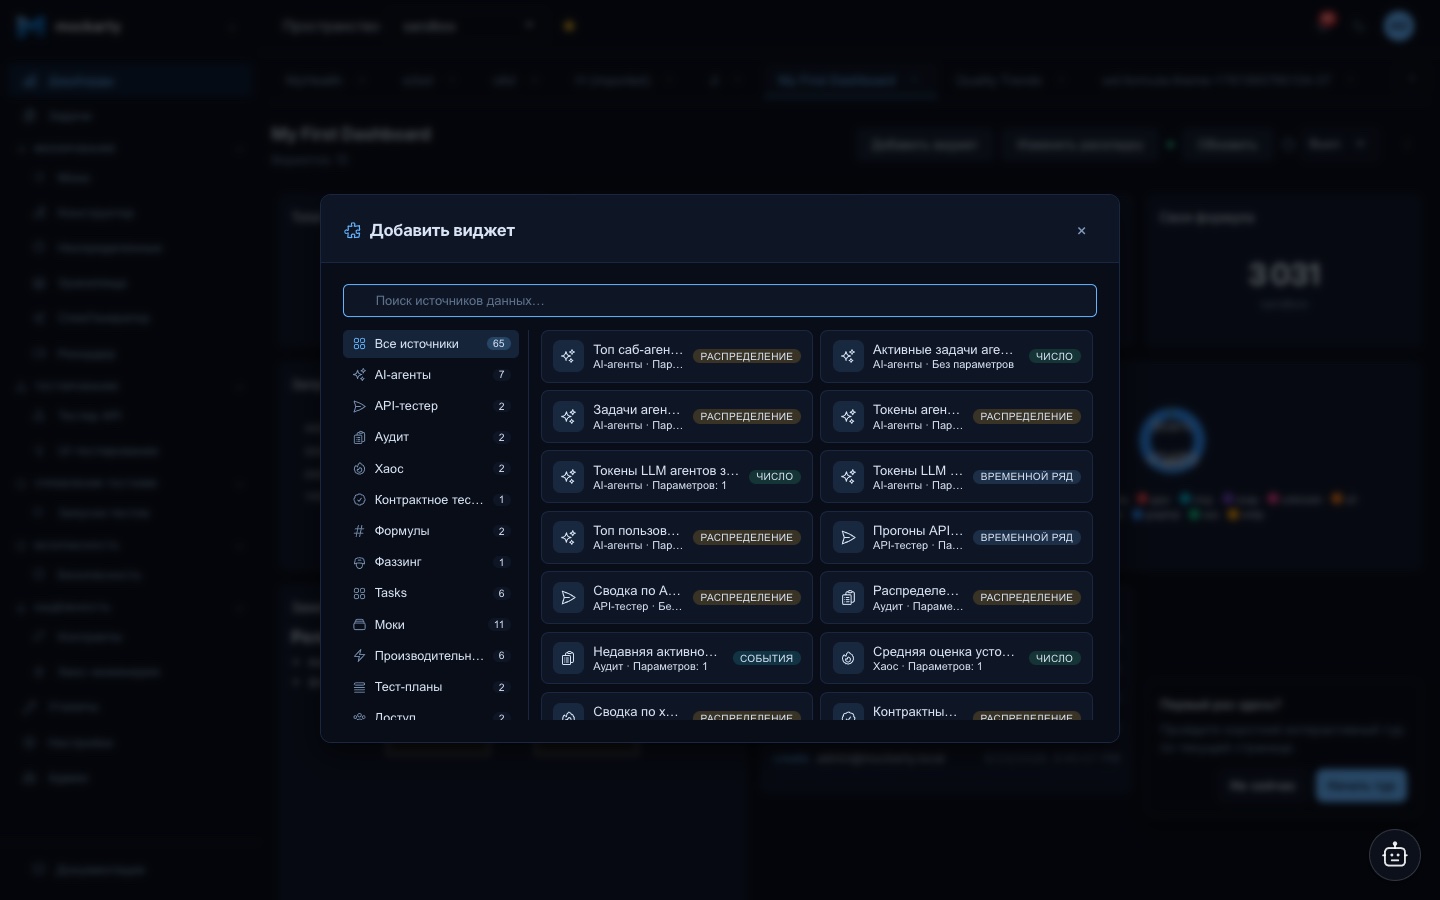
- a data source — what to show (fixed once the widget is created);
- a widget type — how to render it;
- optional parameters — e.g. the time window or the number of entries.
Widget types
| Type | Renders as |
|---|---|
stat |
Big number |
chart_line |
Line chart (time series) |
chart_area |
Filled area chart (time series) |
chart_bar |
Bar chart (categorical comparison) |
chart_pie |
Donut / pie of a breakdown |
top_list |
Ranked top-N list |
table |
Table |
activity |
Activity feed (recent events) |
status |
Health indicator with short text |
breakdown |
Number with sub-bucket roll-up |
text |
Your own Markdown note (with Mermaid diagrams) |
Data sources by category
| Category | Source | Shows | Parameters |
|---|---|---|---|
| Mocks | mock.total_count |
Total number of mocks in the namespace | — |
| Mocks | mock.active_count |
Number of currently active mocks | — |
| Mocks | mock.undefined_count |
Requests that matched no mock | period_days (0 = all time, 1–365) |
| Mocks | mock.requests_total |
Total mock requests over a window | period_days |
| Mocks | mock.top |
Most-hit mocks | period_days, top_n |
| Mocks | mock.unused |
Active mocks nobody called for N days (value = days idle) | idle_days (1–365), top_n (1–50) |
| Mocks | mock.distinct_called |
How many distinct mocks got at least one request in the window | period_days (1–365) |
| Mocks | mock.by_tag |
Active mocks grouped by tag (untagged bucket included) | top_n (1–50) |
| Mocks | mock.requests_trend |
Requests over time | period_days (1–90), bucket (hour / day) |
| Mocks | mock.requests_by_protocol |
Traffic split by protocol | period_days |
| Audit | audit.activity |
Recent audit events (who did what) | limit (1–100) |
| Audit | audit.action_breakdown |
Activity split by action type | period_days (1–365), top_n (1–50) |
| Runners | runner.status |
Runner fleet by status (online / offline) | — |
| Test Cases | tcm.summary |
Test cases by priority | — |
| Test Cases | tcm.cases_by_status |
Test cases by workflow status | folder_id, priority, review_status, severity (all optional) |
| Test Cases | tcm.cases_by_review_status |
Test cases by review status (draft / in review / approved …) | folder_id, priority, severity (optional) |
| Test Cases | tcm.cases_by_priority |
Test cases by priority | folder_id, review_status, severity (optional) |
| Test Cases | tcm.cases_by_severity |
Test cases by severity | folder_id, priority, review_status (optional) |
| Test Cases | tcm.cases_in_review |
How many cases are currently in review | folder_id, priority, severity (optional) |
| Test Cases | tcm.review_age_days |
Average / max age in days of cases in review (proxy, see below) | folder_id, priority, severity (optional) |
| Test Cases | tcm.cases_by_tag |
Test cases grouped by tag (a case counts in every tag it carries; untagged cases bucket into “Untagged”) | top_n (1–50), folder_id, priority, review_status, severity |
| Test Cases | tcm.cases_by_custom_field |
Test cases grouped by the value of one custom field — the Allure-style “group by label” chart. Field names match regardless of case; if one case has duplicate names with different casing, its last value is counted. | field (required), top_n (1–50), folder_id, priority, review_status, severity |
| Test Cases | tcm.cases_by_author |
Top authors of test cases (per team) | top_n (1–50), folder_id, priority, review_status, severity |
| Test Cases | tcm.runs_by_executor |
Top people who ran cases in the window (per team) | top_n (1–50), period_days (1–365) |
| Test Plans | plans.summary |
Plans, schedules and recent runs | — |
| Test Plans | testplan.completions_by_user |
Top people who completed test plans in the window (per team) | top_n (1–50), period_days (1–365) |
| Access | users.cases_authored |
Per-user case-authoring activity in the window (per team) | top_n (1–50), period_days (1–365) |
| API Tester | api_tester.summary |
Collections, tests and reports counts | — |
| API Tester | api_tester.runs_trend |
Test-report runs over time (feeds error-rate charts & formulas) | period_days (1–90), bucket (hour / day), status (all/passed/failed) |
| Fuzzing | fuzz.summary |
Fuzzing findings by severity | — |
| Chaos | chaos.summary |
Chaos experiments by status | — |
| Chaos | chaos.resilience_avg |
Average resilience score (0–100) across chaos runs in the window | period_days |
| AI Agents | agent.tokens_total |
LLM tokens consumed over a window | period_days (1–365) |
| AI Agents | agent.tokens_by_namespace |
Token consumption split by namespace | period_days, top_n (1–50) |
| AI Agents | agent.tokens_trend |
LLM tokens over time | period_days (1–90), bucket (hour / day) |
| AI Agents | agent.users_top |
Top agent users by tokens (per team) | period_days, top_n |
| AI Agents | agent.subagents_top |
Top sub-agents by completed tasks | period_days, top_n |
| Autonomous Coder | coder.mission_cost |
LLM tokens per coder mission (top consumers) | period_days (1–365), limit (1–50) |
| Autonomous Coder | coder.hours_saved |
Human-hours saved by missions completed in the period (issue estimate − runtime to completion) | period_days (1–365), hours_per_point (1–80) |
| Missions | missions.by_status |
Autonomous missions grouped by state | period_days (1–365), product_id (optional) |
| Missions | missions.needs_attention |
Missions waiting for a person | product_id (optional) |
| Missions | missions.throughput |
Finished missions per completion day, including failed and canceled missions | period_days (1–180), product_id (optional) |
| Missions | missions.success_rate |
Successful share of completed missions; canceled missions are excluded | period_days (1–365), product_id (optional) |
| Missions | missions.spend_by_product |
Mission token use by product | period_days (1–365), limit (1–50) |
| Missions | missions.budget_utilisation |
Share of the configured mission token budget used | product_id (optional) |
| AI Agents | agent.tasks_active |
Agent tasks currently running | — |
| AI Agents | agent.tasks_by_status |
Agent tasks split by status | period_days |
| Mocks | mock.users_top |
Top mock authors (per team) | period_days, top_n |
| Security | security.findings_total |
Security findings over a window | period_days (1–365) |
| Security | security.findings_by_severity |
Findings split by severity | period_days |
| Security | security.findings_trend |
Findings over time | period_days (1–90), bucket, severity (all / critical / high / medium / low / info) |
| Performance | perf.campaigns_active |
Load campaigns currently running | — |
| Performance | perf.campaigns_by_status |
Load campaigns split by status | period_days |
| Performance | perf.requests_trend |
Total perf requests executed over time | period_days, bucket |
| Performance | perf.failed_requests_trend |
Failed perf requests over time (pair with requests for an error-rate formula) | period_days, bucket |
| Performance | perf.apdex_avg |
Average APDEX score across runs in the window | period_days |
| Performance | perf.p95_latency_trend |
Average p95 latency (ms) per bucket over time | period_days, bucket |
| Test Runs | test_runs.by_status |
Test runs split by status | period_days |
| Test Runs | test_runs.trend |
Test runs over time | period_days (1–90), bucket, status (all / completed / failed / running / pending / interrupted) |
| Webhooks | webhook.deliveries_by_status |
Webhook deliveries split by status | period_days |
| Webhooks | webhook.deliveries_trend |
Webhook deliveries over time | period_days (1–90), bucket, status (all / delivered / failed / dlq / …) |
| Recorder | recorder.sessions_total |
Recorder sessions over a window | period_days |
| Deploys | deploy.outcomes |
Deploy outcomes for the period: succeeded / failed / rolled back / blocked / cancelled / in flight | period_days (1–90), environment (optional) |
| Deploys | deploy.durations |
Deploy duration percentiles (seconds); the stat value shows the chosen percentile | period_days (1–90), percentile (p50 / p95), environment (optional) |
| Deploys | deploy.runs |
Latest deploys with their per-run state and duration | limit (1–50), period_days (1–90), environment (optional) |
| Contracts | contract.summary |
Contract runs split by report type | period_days |
| Access | rbac.namespace_users |
Namespace members split by role | — |
| Tasks | issuetracker.issues_by_status |
Issues split by workflow status | — |
| Tasks | issuetracker.issues_by_priority |
Issues split by priority | — |
| Tasks | issuetracker.issues_by_assignee |
Issues split by assignee (per team) | — |
| Tasks | issuetracker.open_count |
Open (not done) issues | — |
| Tasks | issuetracker.overdue_count |
Issues past their due date | — |
| Tasks | issuetracker.created_trend |
Issues created over time | period_days (1–90), bucket (hour / day) |
| Messenger | chat.messages_by_author_kind |
Chat messages split by author kind (people / agents / system) | — |
| Messenger | chat.messages_by_thread_kind |
Chat messages split by thread kind (discussions / DMs / channels) | — |
| Messenger | chat.threads_total |
Discussion threads (open, not archived) | — |
| Wiki | wiki.pages_total |
Live wiki pages | — |
| Wiki | wiki.pages_created_trend |
Wiki pages created over time | period_days (1–90), bucket (hour / day) |
| Wiki | wiki.edits_trend |
Wiki edits (saves) over time | period_days (1–90), bucket (hour / day) |
| System | system.resources |
Host CPU / memory / disk utilisation | — |
| System | system.runtime |
Server process runtime (goroutines, heap, GC, uptime) | — |
| System | system.db_pool |
Database pool connections, wait count and wait time on the node serving the dashboard (not a cluster total) | — |
| Formulas | formula.custom |
Your own derived metric computed from other sources | expression, operands |
| Formulas | formula.timeseries |
Your own chart: a formula evaluated per time bucket over trend sources (e.g. error rate over time) | expression, operands |
| Other | static.text |
Your own Markdown note (text widget) | — |
| Other | static.html |
Your own HTML (scripts allowed) rendered in a sandboxed frame | — |
| Other | static.embed |
A live external page framed as a card (e.g. a Grafana board) | — |
Hourly and daily buckets for test runs, security findings, AI token use, API
Tester reports, webhook deliveries, performance requests and latency, and
mission throughput use UTC. A chart therefore shows the same bucket on each
server node even when their database sessions use different time zones.
Parameters are validated against the source’s schema when you save — an unknown
parameter or an out-of-range value is rejected with a clear error message, the widget
is not created.
The exact, always-current catalog (including each source’s parameter schema) is
available from the API: GET /api/v1/widget-dashboards/catalog.
Team analytics
Beyond “how is the tool being used”, dashboards answer management questions about
people and process: who is writing the most test cases, who completed which test
plans, how many cases are sitting in review and for how long.
- Process sources (
tcm.cases_by_review_status,tcm.cases_by_priority,
tcm.cases_by_severity,tcm.cases_in_review,tcm.review_age_days) show
the shape of the test-case backlog with fixed labels or counts. They can be
shown on a shared global dashboard. Workflow status names, tags and
custom-field values can contain team data, so their breakdowns stay scoped
to one namespace. - People sources (
tcm.cases_by_author,tcm.runs_by_executor,
testplan.completions_by_user,users.cases_authored) attribute work to the
individual teammate. Because they surface a person’s identity, they are
team-scoped only: you see your own team’s contributors, never people in
another team, and they cannot be added to a global dashboard.
All process and people sources accept optional filters so you can narrow to one
folder, priority, review status or severity — pick a value when adding the widget,
and the widget recomputes against only the matching cases. Two indirect-signal
filters narrow by the same metadata Allure users rely on: tag (only cases carrying
that tag) and cf (only cases with a custom field, written as key=value, e.g.
component=cart). Combine them — e.g. “cases by priority, tag=regression,
cf=team=payments” — to slice any breakdown the way your process actually works.
Review age is a proxy. tcm.review_age_days reports how long cases have been in
review by measuring the time since each case was last edited (now − last update). A
case that has been actively edited shows a younger age; a stale case in review shows
its true backlog age. The widget labels this honestly as a proxy — Mockarty does not
yet store a dedicated “moved into review at” timestamp.
Formulas — your own metrics
The Custom formula source (category Formulas) lets you build a metric Mockarty
does not ship out of the box — by combining other sources with plain arithmetic. No
query language: you name up to 5 operands (letters A–E), bind each to a data
source, and write an expression like A / B * 100.
In the Add-widget picker, choose Custom formula and the configuration step shows
a formula builder instead of the usual parameter form:
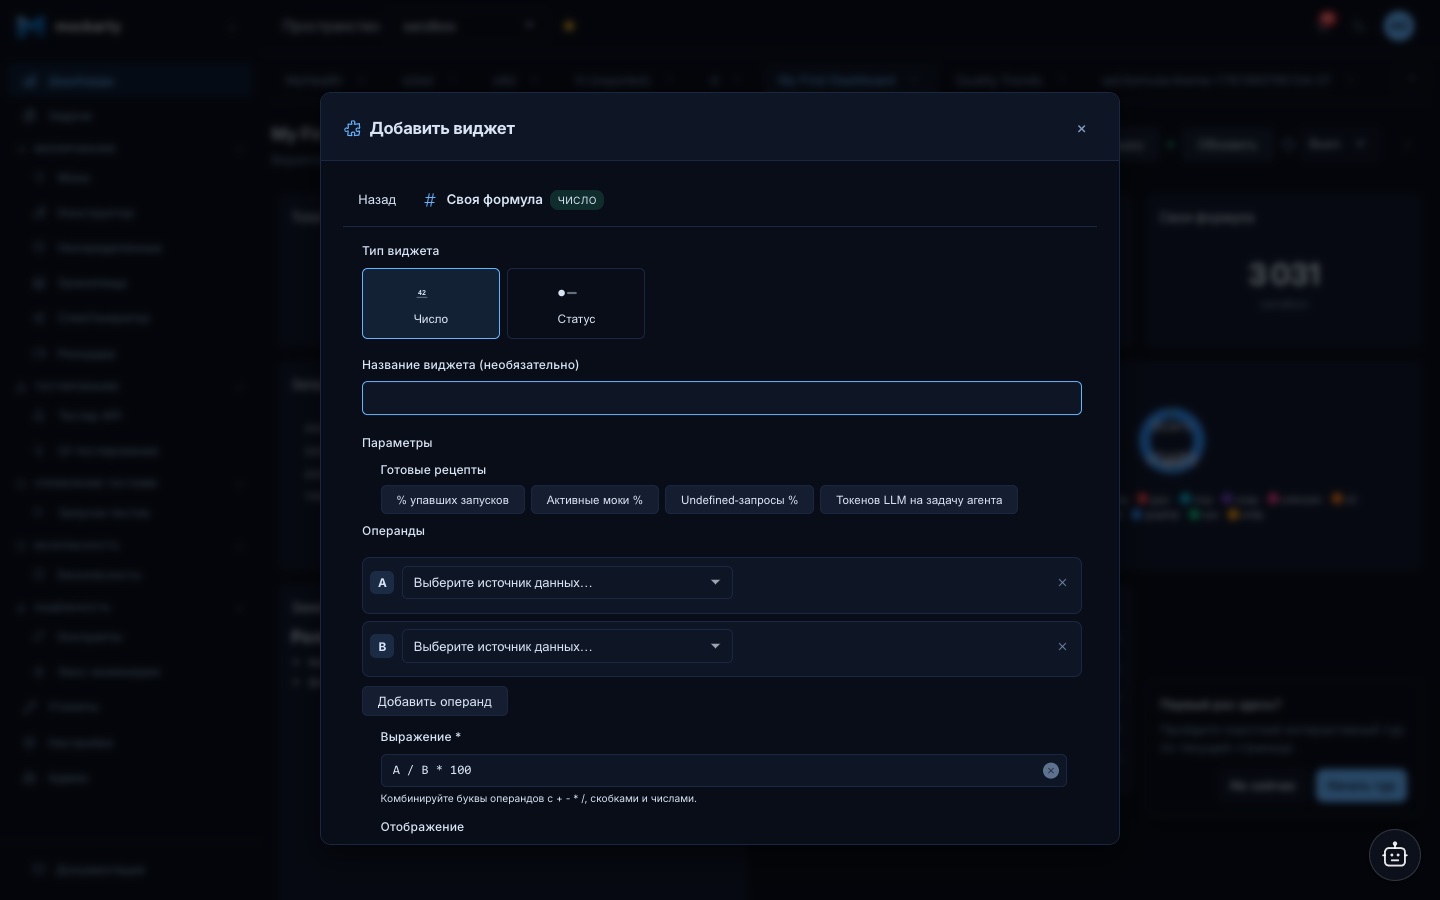
- Operands — one row per letter. Each row picks a data source (any source that
produces a number or a distribution; a formula cannot reference another formula).
For distribution sources you also choose the metric: Sum (total) or Item by
name… — one named slice, matched case-insensitively (e.g.failed). If the
source takes parameters (likeperiod_days), a compact parameter form appears
right in the row. - Expression — arithmetic over the operand letters:
+ - * /, parentheses,
numbers (decimals are fine), unary minus. Validated live as you type; the same
validation runs on the server when you save. - Display — decimals (Auto / 0–3) and a free-text suffix (e.g.
%) for the
rendered number.
The result is a single number, so the Stat and Status widget types apply —
including thresholds (e.g. turn the card red when the failure rate crosses 5).
Example — a “failed test runs %” stat:
- Operand
A: source Test runs by status, metric Item by name… →failed. - Operand
B: source Test runs by status, metric Sum (total). - Expression:
A / B * 100, suffix%, decimals1.
Division by zero and a missing item name render as an error inside that widget only —
the rest of the dashboard keeps working.
Add a formula widget via the API
curl -X POST -H "X-API-Key: $TOKEN" -H "Content-Type: application/json" \
  -d '{
    "title": "Failed runs %",
    "widgetType": "stat",
    "dataSourceId": "formula.custom",
    "paramsJson": {
      "expression": "A / B * 100",
      "operands": [
        {"ref": "A", "sourceId": "test_runs.by_status", "select": "item:failed"},
        {"ref": "B", "sourceId": "test_runs.by_status", "select": "total"}
      ]
    },
    "vizOptionsJson": {"decimals": 1, "suffix": "%"},
    "gridW": 3, "gridH": 3
  }' \
  "http://localhost:5770/api/v1/widget-dashboards/<dashboardId>/widgets?namespace=default"
select is "total" (default) or "item:<name>" for distribution sources; number
sources need no select. An invalid expression, an unknown operand source, or a
letter used in the expression without an operand row is rejected with a precise
error message.
Custom charts — a formula over time
The Custom chart (formula over time) source (formula.timeseries) is the same
builder, but every operand binds to a trend source ("… over time") and the
expression is evaluated once per time bucket — the result is a series you render
with the Line or Area widget types.
The builder starts with Quick recipes — one-click templates for the common
formulas (test-run error rate, webhook success share, critical-findings share).
Pick a recipe and adjust, or build from scratch:
- Set the Time axis — one window (days) and bucket (
hour/day) for the
whole formula. Every operand uses this axis, so the series always align. - Operand
A: source Test runs over time, parameterstatus→failed. - Operand
B: source Test runs over time,status→all. - Expression:
A / B * 100. Widget type: Line.
A bucket where the expression cannot be computed (for example, division by zero
on a day with no runs) is simply left out — the chart shows a gap instead of a
fake zero.
Display options work here too: set decimals and a unit suffix (e.g. %) and
the chart’s y-axis and tooltip show 60.7 % instead of a raw number. The tooltip
names the series after the widget title.
Threshold zones. Line, area and bar charts accept the same thresholds as the
stat widgets — and draw them as colored zones: a translucent band starts at each
threshold value with a dashed boundary line, so “above 5% is bad” is visible at a
glance. The y-axis extends to keep the highest zone in view even when the data has
not reached it yet. Add thresholds in the widget’s settings or via the API
(vizOptionsJson.thresholds, e.g. [{"value": 5, "color": "yellow"}, {"value": 10, "color": "red"}]).
Text & notes — Markdown widgets
The Text / note source (category Other) adds a free-form text card to the
dashboard: a runbook excerpt, on-call contacts, a legend explaining the metrics
around it, links to related docs. It is the only widget that fetches no data — you
write the content yourself.
Pick Text / note in the Add-widget picker and the configuration step shows a
Content (Markdown) editor instead of parameters. The content supports standard
Markdown:
- headings, paragraphs, bold / italic;
- bullet and numbered lists, tables, quotes;
- inline
codeand fenced code blocks; - links and images.
Raw HTML is sanitized away — scripts, frames and event handlers never render, so a
text widget is safe to put on a shared (global) dashboard too.
Custom HTML & live embeds
Two more author-your-own widgets live next to Text / note (category Other):
Custom HTML (static.html) renders HTML you write — scripts included — inside
a sandboxed iframe on the card. Scripts can call the application’s own API with
your session (fetch('/api/v1/…', {credentials: 'include'})), pull data from
anywhere else you can reach, and draw the result however you like. This makes the
dashboard fully programmable: an agent (or you) can generate a bespoke
visualisation as a single HTML snippet and drop it onto the board. The card
resizes like any other widget and the size is saved. Content limit: 16 KB.
Because the HTML runs with the viewer’s session, authoring is restricted: only a
namespace owner (or a system admin / support) can create or edit a Custom HTML
widget — the server enforces it. This mirrors Grafana’s admin-only HTML panels.
Embed / iframe (static.embed) frames a live external page inside the card:
a Grafana board, a status page, any dashboard reachable from the viewer’s browser.
Enter the page URL — the target must allow embedding (it must not send
X-Frame-Options: DENY / a restrictive frame-ancestors). Authentication is the
browser’s own: sign in to the embedded site in the same browser and its cookies
apply inside the frame (for cross-site setups the target must issue its session
cookie with SameSite=None; Secure). Grafana tip: append ?kiosk to hide its
chrome, and enable allow_embedding = true in grafana.ini.
Mermaid diagrams
A fenced code block with the mermaid language renders as a diagram right on the
card — flowcharts, sequence diagrams, state machines:
# Release flow

```mermaid
graph LR
  Build --> Test --> Deploy
```
Diagrams follow the light/dark theme automatically. If a diagram has a syntax
error, an inline error note appears in its place — the rest of the card still
renders.
To change the text later, open the widget’s settings (gear icon) — the same editor
appears with the current content.
Add a text widget via the API
The content travels in vizOptionsJson.markdown (up to 16 KB); paramsJson stays
empty for this source:
curl -X POST -H "X-API-Key: $TOKEN" -H "Content-Type: application/json" \
  -d '{
    "title": "Team runbook",
    "widgetType": "text",
    "dataSourceId": "static.text",
    "vizOptionsJson": {"markdown": "# On-call\n\n- Check the error-rate widget first\n\n```mermaid\ngraph LR\n  Alert --> Triage --> Fix\n```"},
    "gridW": 4, "gridH": 4
  }' \
  "http://localhost:5770/api/v1/widget-dashboards/<dashboardId>/widgets?namespace=default"
Layout: drag, resize, pin
The grid has 12 columns. In edit mode:
- Drag a widget by its header to move it; neighbouring widgets are pushed out of
the way automatically. - Resize from the bottom-right corner. Each widget has a minimum size.
- Pin a widget to protect it from being pushed around by other widgets.
The layout is saved automatically after a drag/resize session and survives page
refreshes for everyone in the namespace.
Live updates
The dashboard you are viewing updates itself — there is no need to press
Refresh. A small dot next to the Refresh button shows the connection state:
- Green, pulsing — live updates are active. The dashboard checks for new
widget values and repaints when they change. - Grey — the connection dropped and the page is reconnecting; it recovers
on its own within a few seconds.
Test-case changes also refresh the related dashboard totals when they are
made through another Mockarty admin node. A short delay while the change
reaches the dashboard is normal.
While you are editing the layout, live repaints are held back so the grid does
not move under your cursor; the freshest data appears as soon as you save or
cancel the edit.
The auto-refresh interval select in the toolbar remains available as a
polling fallback (for example, when a corporate proxy blocks streaming
connections). With live updates working, leaving it Off is the right
choice.
Exporting & printing
Open the dashboard’s ⋮ menu (top-right of the toolbar) to share a dashboard
outside Mockarty:
- Export HTML — downloads a single, fully self-contained
.htmlfile: the
dashboard exactly as you see it (grid layout, cards, charts as static images),
with no external resources, so it opens anywhere — including air-gapped
machines and e-mail attachments. The file also carries machine-readable
attributes (data-widget-id,data-widget-type,data-source-id,
data-params,data-gridon every card;data-valueon stat numbers), so
scripts and BI tooling can parse the snapshot without scraping the visuals. - Export JSON — downloads the dashboard configuration plus freshly computed
widget data from the server:{dashboard, widgets, data}. Each widget entry
carries itstype,dataSourceId,params,gridposition and
thresholds;datacarries the same per-widget slots as the live render. - Export CSV — downloads a flat metric table for Excel / Google Sheets / BI
tools:widget_id, widget_title, widget_type, data_source_id, metric, value,
one row per value (a pie chart yields one row per slice, a time series one
row per point). The file starts with a UTF-8 BOM so Excel detects the
encoding correctly. - Export configuration — downloads the dashboard’s configuration only (no
data, no internal ids, no namespace) as a portable JSON file. Use it to hand a
dashboard to another team — see the next section. - Import dashboard — creates a new dashboard from such a configuration file.
Also available from the empty state when the namespace has no dashboards yet. - Print / PDF — opens the browser print dialog. Pick Save as PDF as the
destination. App chrome (sidebar, tabs, toolbar) is hidden automatically; the
widget grid prints in a light palette, and each card stays on one page.
JSON and CSV exports are computed server-side, so they reflect the current data,
not what your browser cached. Every export is recorded in the audit log.
Sharing a dashboard between teams
When one team builds a dashboard worth copying, export its configuration and
hand the file over — the receiving team imports it into their own namespace and
the widgets recompute against their data:
- On the source dashboard, open the ⋮ menu → Export configuration. You
get a<name>-config.jsonfile containing only the dashboard name,
description and widget configuration (type, data source, parameters,
thresholds, grid layout). Nothing namespace-specific travels with it. - The receiving team opens Custom Dashboards in their namespace and picks
⋮ menu → Import dashboard (or Import dashboard on the empty state),
then selects the file. A new dashboard appears and becomes active.
Import rules:
- Importing requires write access (namespace owner, admin or support).
- The file is validated strictly: widget types and data sources must exist on
the receiving server, and widget parameters are re-checked against each data
source’s schema. Unknown data sources are listed in the error message. - If a dashboard with the same name already exists, the import is named
<name> (imported)(then<name> (imported 2)and so on). - The 30-widget and 200-character limits apply to imports too.
Limits
- 30 widgets per dashboard — the 31st add is refused, including when several people add widgets at the same time.
- If an older dashboard already contains more than 30 widgets, dashboard, data and export requests return HTTP 409. Ask an administrator to repair the stored configuration; the server does not silently omit widgets.
- Dashboard names and widget titles: up to 200 characters.
- Widget data is cached server-side for a short, per-source interval (from a few
seconds up to a few minutes), so a busy dashboard stays cheap even with many viewers. - If one data source fails, only that widget shows an error — the rest of the
dashboard renders normally.
API examples
All endpoints live under /api/v1/widget-dashboards. The namespace travels in the
?namespace= query parameter (defaults to default). Authenticate with an API token
in the X-API-Key header.
List dashboards
curl -H "X-API-Key: $TOKEN" \
  "http://localhost:5770/api/v1/widget-dashboards?namespace=default"
Create a dashboard
curl -X POST -H "X-API-Key: $TOKEN" -H "Content-Type: application/json" \
  -d '{"name": "Team QA overview", "description": "Mocks + test health"}' \
  "http://localhost:5770/api/v1/widget-dashboards?namespace=default"
Browse the data-source catalog
curl -H "X-API-Key: $TOKEN" \
  "http://localhost:5770/api/v1/widget-dashboards/catalog"
Add a widget
curl -X POST -H "X-API-Key: $TOKEN" -H "Content-Type: application/json" \
  -d '{
    "title": "Requests over time",
    "widgetType": "chart_line",
    "dataSourceId": "mock.requests_trend",
    "paramsJson": {"period_days": 7, "bucket": "day"},
    "gridX": 0, "gridY": 0, "gridW": 6, "gridH": 4
  }' \
  "http://localhost:5770/api/v1/widget-dashboards/<dashboardId>/widgets?namespace=default"
Get a dashboard with its widgets
curl -H "X-API-Key: $TOKEN" \
  "http://localhost:5770/api/v1/widget-dashboards/<dashboardId>?namespace=default"
Fetch live widget data
curl -H "X-API-Key: $TOKEN" \
  "http://localhost:5770/api/v1/widget-dashboards/<dashboardId>/data?namespace=default"
Each item in the response carries either data (the rendered value) or error
(why this particular widget could not compute) — a failing source never breaks the
whole response.
When this node is busy rendering other dashboards, /data returns HTTP 429
with Retry-After: 1. Retry after that interval rather than sending many
concurrent requests. The limit applies independently on each cluster node.
Stream live widget data (SSE)
curl -N -H "X-API-Key: $TOKEN" \
  "http://localhost:5770/api/v1/widget-dashboards/<dashboardId>/stream?namespace=default"
The server keeps the connection open and pushes an event: widgets frame with
the same items shape as the /data endpoint — but only when the values
actually change. Comment heartbeats keep the connection alive in between. The
web UI uses this stream for its live updates; you can consume it from scripts
or external dashboards as well.
When rendering capacity is busy, the stream keeps its last frame and retries
on the next update interval; an unchanged frame is not sent again.
Export a dashboard (JSON / CSV)
# Configuration + freshly computed data as JSON
curl -OJ -H "X-API-Key: $TOKEN" \
  "http://localhost:5770/api/v1/widget-dashboards/<dashboardId>/export?namespace=default&format=json"

# Flat metric table for Excel / BI tools
curl -OJ -H "X-API-Key: $TOKEN" \
  "http://localhost:5770/api/v1/widget-dashboards/<dashboardId>/export?namespace=default&format=csv"
-OJ saves the file under the name the server suggests
(<dashboard-name>-<date>.json / .csv).
JSON and CSV exports may return HTTP 429 with Retry-After: 1 while data
rendering is busy. A configuration-only export does not compute widget data and
remains available.
Move a dashboard to another team (config export + import)
# 1. Export the portable configuration (no data, no ids, no namespace)
curl -OJ -H "X-API-Key: $TOKEN" \
  "http://localhost:5770/api/v1/widget-dashboards/<dashboardId>/export?namespace=team-a&format=config"

# 2. Import it into another namespace (file from step 1 as the body)
curl -X POST -H "X-API-Key: $TOKEN" -H "Content-Type: application/json" \
  --data @overview-config.json \
  "http://localhost:5770/api/v1/widget-dashboards/import?namespace=team-b"
The import answers 201 with the created dashboard. A 400 lists exactly what
the receiving server did not accept (e.g. unknown data sources).
Update dashboard name / description
curl -X PATCH -H "X-API-Key: $TOKEN" -H "Content-Type: application/json" \
  -d '{"name": "Team QA overview v2"}' \
  "http://localhost:5770/api/v1/widget-dashboards/<dashboardId>?namespace=default"
Update a widget
curl -X PATCH -H "X-API-Key: $TOKEN" -H "Content-Type: application/json" \
  -d '{"title": "Mock traffic (14d)", "paramsJson": {"period_days": 14}}' \
  "http://localhost:5770/api/v1/widget-dashboards/<dashboardId>/widgets/<widgetId>?namespace=default"
Save the layout in bulk
curl -X PUT -H "X-API-Key: $TOKEN" -H "Content-Type: application/json" \
  -d '{"items": [{"id": "<widgetId>", "gridX": 6, "gridY": 0, "gridW": 6, "gridH": 4}]}' \
  "http://localhost:5770/api/v1/widget-dashboards/<dashboardId>/layout?namespace=default"
Duplicate a dashboard
curl -X POST -H "X-API-Key: $TOKEN" -H "Content-Type: application/json" \
  -d '{"name": "Team QA overview (copy)"}' \
  "http://localhost:5770/api/v1/widget-dashboards/<dashboardId>/duplicate?namespace=default"
Delete a widget / a dashboard
curl -X DELETE -H "X-API-Key: $TOKEN" \
  "http://localhost:5770/api/v1/widget-dashboards/<dashboardId>/widgets/<widgetId>?namespace=default"

curl -X DELETE -H "X-API-Key: $TOKEN" \
  "http://localhost:5770/api/v1/widget-dashboards/<dashboardId>?namespace=default"
After a dashboard is deleted, reads on it answer 404.