Mockarty Web UI Guide
Welcome to the Mockarty Web UI Guide. Whether you are a QA engineer creating your first mock, a developer integrating Mockarty into a CI/CD pipeline, or an architect designing multi-protocol test environments, this guide walks you through every page and feature of the web interface step by step.
This document covers all 17 sidebar navigation items, the floating Agent Chat, API token management, role-based access control, and best practices for getting the most out of Mockarty.
Key Terms
Before diving in, here are a few terms used throughout this guide:
- Mock – A simulated API endpoint that returns predefined responses instead of calling a real service. Mocks let you test your application without depending on external systems.
- Stub – In Mockarty, “stub” and “mock” are used interchangeably. Both refer to a configured endpoint that returns a controlled response.
- Condition – A rule that determines when a mock should match an incoming request. For example, “match only when the request body contains
status: active.” - Namespace – An isolated workspace that keeps mocks, stores, and test collections separate between teams or projects.
- Store – A key-value storage mechanism that lets mocks remember state across requests. Mockarty provides three store types: Global, Chain, and Mock.
- Faker – A built-in library of functions that generate realistic random data (names, emails, UUIDs, etc.) for mock responses.
Table of Contents
- Getting Started
- Interface Overview
- Dashboards
- Mocks
- Constructor
- Undefined Requests
- Stores
- Generator
- API Tester
- Test Runs
- Test Cases
- Test Plans
- Recorder
- Fuzzing
- Contract Testing
- Chaos Engineering
- Utils
- Templates
- Settings
- Admin Panel
- Support Panel
- AI Features
- Agent Chat
- API Tokens
- Roles and Permissions
- Tips and Best Practices
Getting Started
Accessing the UI
After starting your Mockarty instance, open a web browser and navigate to:
http://localhost:5770/ui/
Replace localhost:5770 with your actual host and port if you have configured a custom HTTP port via the HTTP_PORT environment variable or are accessing a remote deployment. For installation and deployment instructions, see the Deployment Guide. For a full table of deployment scenarios and URL patterns, see Tips & Useful Features.
The UI is fully responsive and works across modern desktop browsers (Chrome, Firefox, Safari, Edge). While the interface is optimized for desktop use, basic operations work on tablet-sized screens as well.
Authentication
Mockarty supports multiple authentication strategies. Your administrator will have configured one or more of the following methods:
Local Authentication
The default authentication method. Users log in with a username (or email) and password. Passwords are securely hashed and stored in the database. Local authentication supports:
- Password complexity requirements configurable by the administrator.
- Account lockout after repeated failed login attempts.
- Password reset via email (when email notifications are enabled).
OAuth 2.0
Mockarty supports OAuth 2.0 authentication with three built-in providers configured via environment variables:
- Google (
OAUTH_GOOGLE_ENABLED,OAUTH_GOOGLE_CLIENT_ID,OAUTH_GOOGLE_SECRET) - Yandex (
OAUTH_YANDEX_ENABLED,OAUTH_YANDEX_CLIENT_ID,OAUTH_YANDEX_SECRET) - VK (
OAUTH_VK_ENABLED,OAUTH_VK_CLIENT_ID,OAUTH_VK_SECRET)
In addition, any OAuth2/OIDC provider can be added through the Admin panel under Identity Providers – for example GitHub, GitLab, Keycloak, Azure AD, Okta, and others. The generic provider configuration requires: Auth URL, Token URL, UserInfo URL, Client ID, Client Secret, and Scopes. Mockarty automatically detects standard user info fields (id/sub, email, name, avatar) from the provider’s UserInfo response.
When configured, a “Sign in with …” button appears on the login page. After authenticating with the external provider, users are automatically provisioned in Mockarty if they do not already have an account.
LDAP / Active Directory
For enterprise environments, Mockarty can authenticate users against an LDAP or Active Directory server. User attributes (name, email, groups) are synchronized from the directory. Group memberships can be mapped to Mockarty roles for automatic role assignment.
SAML SSO
SAML 2.0 Single Sign-On enables authentication through identity providers such as Okta, OneLogin, Azure AD, and others. When configured, users are redirected to the identity provider’s login page and returned to Mockarty upon successful authentication.
Two-Factor Authentication (2FA)
Regardless of the primary authentication method, users can enable two-factor authentication for additional security. Mockarty supports:
- Time-based One-Time Passwords (TOTP) via authenticator apps (Google Authenticator, Authy, etc.).
- Email-based one-time codes (when email notifications are enabled).
2FA can be enforced by the administrator for all users or specific roles.
First Login and Initial Setup
When you log in to Mockarty for the first time:
-
Default credentials: If using local authentication, the default administrator account is typically
admin/admin. Change this password immediately after your first login. -
Namespace selection: Mockarty organizes all resources (mocks, stores, test collections) into namespaces. After login, you will be placed into the default namespace. You can create additional namespaces from the Settings page.
-
Create your first mock: Navigate to the Constructor page to create your first mock, or use the Generator page to import mocks from an existing OpenAPI specification, WSDL file, or other supported format. See the Quick Start guide for a step-by-step walkthrough.
-
Explore the dashboard: The Dashboards page provides an overview of your Mockarty instance, including mock resolution statistics and system health metrics.
Interface Overview
The Mockarty Web UI follows a consistent layout across all pages, with a collapsible sidebar on the left, a top bar with global controls, and a main content area.
Sidebar Navigation
The sidebar contains 17 navigation items organized into logical groups:
| Icon | Page | Path | Description |
|---|---|---|---|
| Dashboards | /ui/dashboards |
System analytics and mock resolution stats | |
| Mocks | /ui/mocks |
Browse, search, and manage all mocks | |
| Constructor | /ui/constructor |
Create and edit mocks visually | |
| Undefined | /ui/undefined |
View unmatched requests (404s) | |
| Stores | /ui/stores |
Manage Global, Chain, and Mock stores | |
| Generator | /ui/generator |
Import mocks from specs (OpenAPI, WSDL, etc.) | |
| API Tester (Preview) | /ui/api-tester |
Full-featured API testing workbench | |
| Test Runs (Preview) | /ui/test-runs |
View test execution results and reports | |
| Recorder | /ui/recorder |
Capture and replay real traffic | |
| Security | /ui/security |
Fuzz testing and security analysis | |
| Contracts | /ui/contract-testing |
Validate mocks against API specifications | |
| Chaos | /ui/chaos |
Kubernetes chaos engineering experiments | |
| Utils | /ui/utils |
Developer utilities (JSON, Base64, UUID, etc.) | |
| Settings | /ui/settings |
Namespace, user, and integration settings (admin and support roles only) | |
| Admin | /ui/admin |
System-wide administration (admin only) | |
| Support | /ui/support |
Support panel for users with the support role |
Preview badges: Pages marked with “Preview” display a Preview badge in the sidebar. These features are fully functional but are in preview/beta state and may receive significant changes in future releases.
Feature visibility: The Security, Contract Testing, and Chaos Engineering nav items are hidden by default and are shown only when the corresponding feature is enabled via license or feature flags.
Docs link: The Docs link (
/ui/docs) is located in a separate section at the very bottom of the sidebar, below the main navigation list. It provides access to the built-in documentation browser.
The sidebar can be collapsed to icons-only mode by clicking the toggle button at the bottom, giving more screen space to the main content area.
The active page is highlighted in the sidebar with a distinct accent color. The sidebar footer displays the current Mockarty version number.
Top Bar
The top bar appears on every page and contains:
-
Namespace selector: A dropdown menu showing the currently active namespace. Switch between namespaces to view and manage resources scoped to each one. All mock creation, store operations, and test collections are namespace-scoped.
-
Global search: A search input that allows you to quickly find mocks by name, ID, route, or tag across the current namespace. Results appear as you type with links to the matching mock detail pages.
-
Notifications indicator: Shows pending notifications such as completed test runs, backup status, or system alerts.
User Menu
Clicking your username or avatar in the top-right corner opens a dropdown menu with:
- Language: Switch the UI language. Mockarty ships with English and Russian translations.
- Settings: Open the user settings modal (profile, 2FA, API tokens, theme).
- API Tokens: Manage your personal API tokens for programmatic access to the Mockarty REST API. Not shown for auditor role.
- Profile: View and edit your user profile.
- Logout: End your current session.
Profile Picture (Avatar)
Every user can set a profile picture. It is shown next to your name across the product — in the header, user pickers, namespace member lists, and comment author rows — so teammates see a real person instead of just a login.
To upload an avatar:
- Open the user menu (top-right) and choose Settings.
- Switch to the Profile tab.
- Click Upload avatar and pick a PNG, JPEG, or WebP file up to 5 MB.
The server automatically resizes the image to 256×256 pixels, so no cropping tool is needed. Click Remove to delete the picture — the UI falls back to your initials on a color generated from your login.
If you sign in through an OAuth provider or a corporate directory (LDAP/Active Directory), Mockarty automatically picks up the profile picture published by the provider (the OAuth picture claim or the LDAP jpegPhoto/thumbnailPhoto attribute). A picture you upload manually always takes priority and is never overwritten by the provider.
Theme Toggle
Mockarty supports two visual themes:
- Light theme: Clean, bright interface optimized for well-lit environments.
- Dark theme: Reduced brightness with dark backgrounds, optimized for low-light environments and reduced eye strain.
The theme applies to the entire UI, including the sidebar, content area, modals, and embedded code editors. Theme preference is stored per-browser in localStorage.
Language Switcher
The language switcher (accessible from the user menu) allows you to change the UI language. All labels, buttons, tooltips, error messages, and help text are translated. Currently supported languages:
- English (en) – default
- Russian (ru)
The language preference is stored in your user profile and persists across sessions and devices.
Dashboards
Path: /ui/dashboards
The Dashboards page is your home screen in Mockarty. It gives you a bird’s-eye view of how your mocks are being used: which protocols get the most traffic, how many requests matched (or missed) a mock, and overall system health. The page provides real-time analytics cards, charts, and summary tables so you can understand what is happening in your testing environment at a glance.


System Analytics Cards
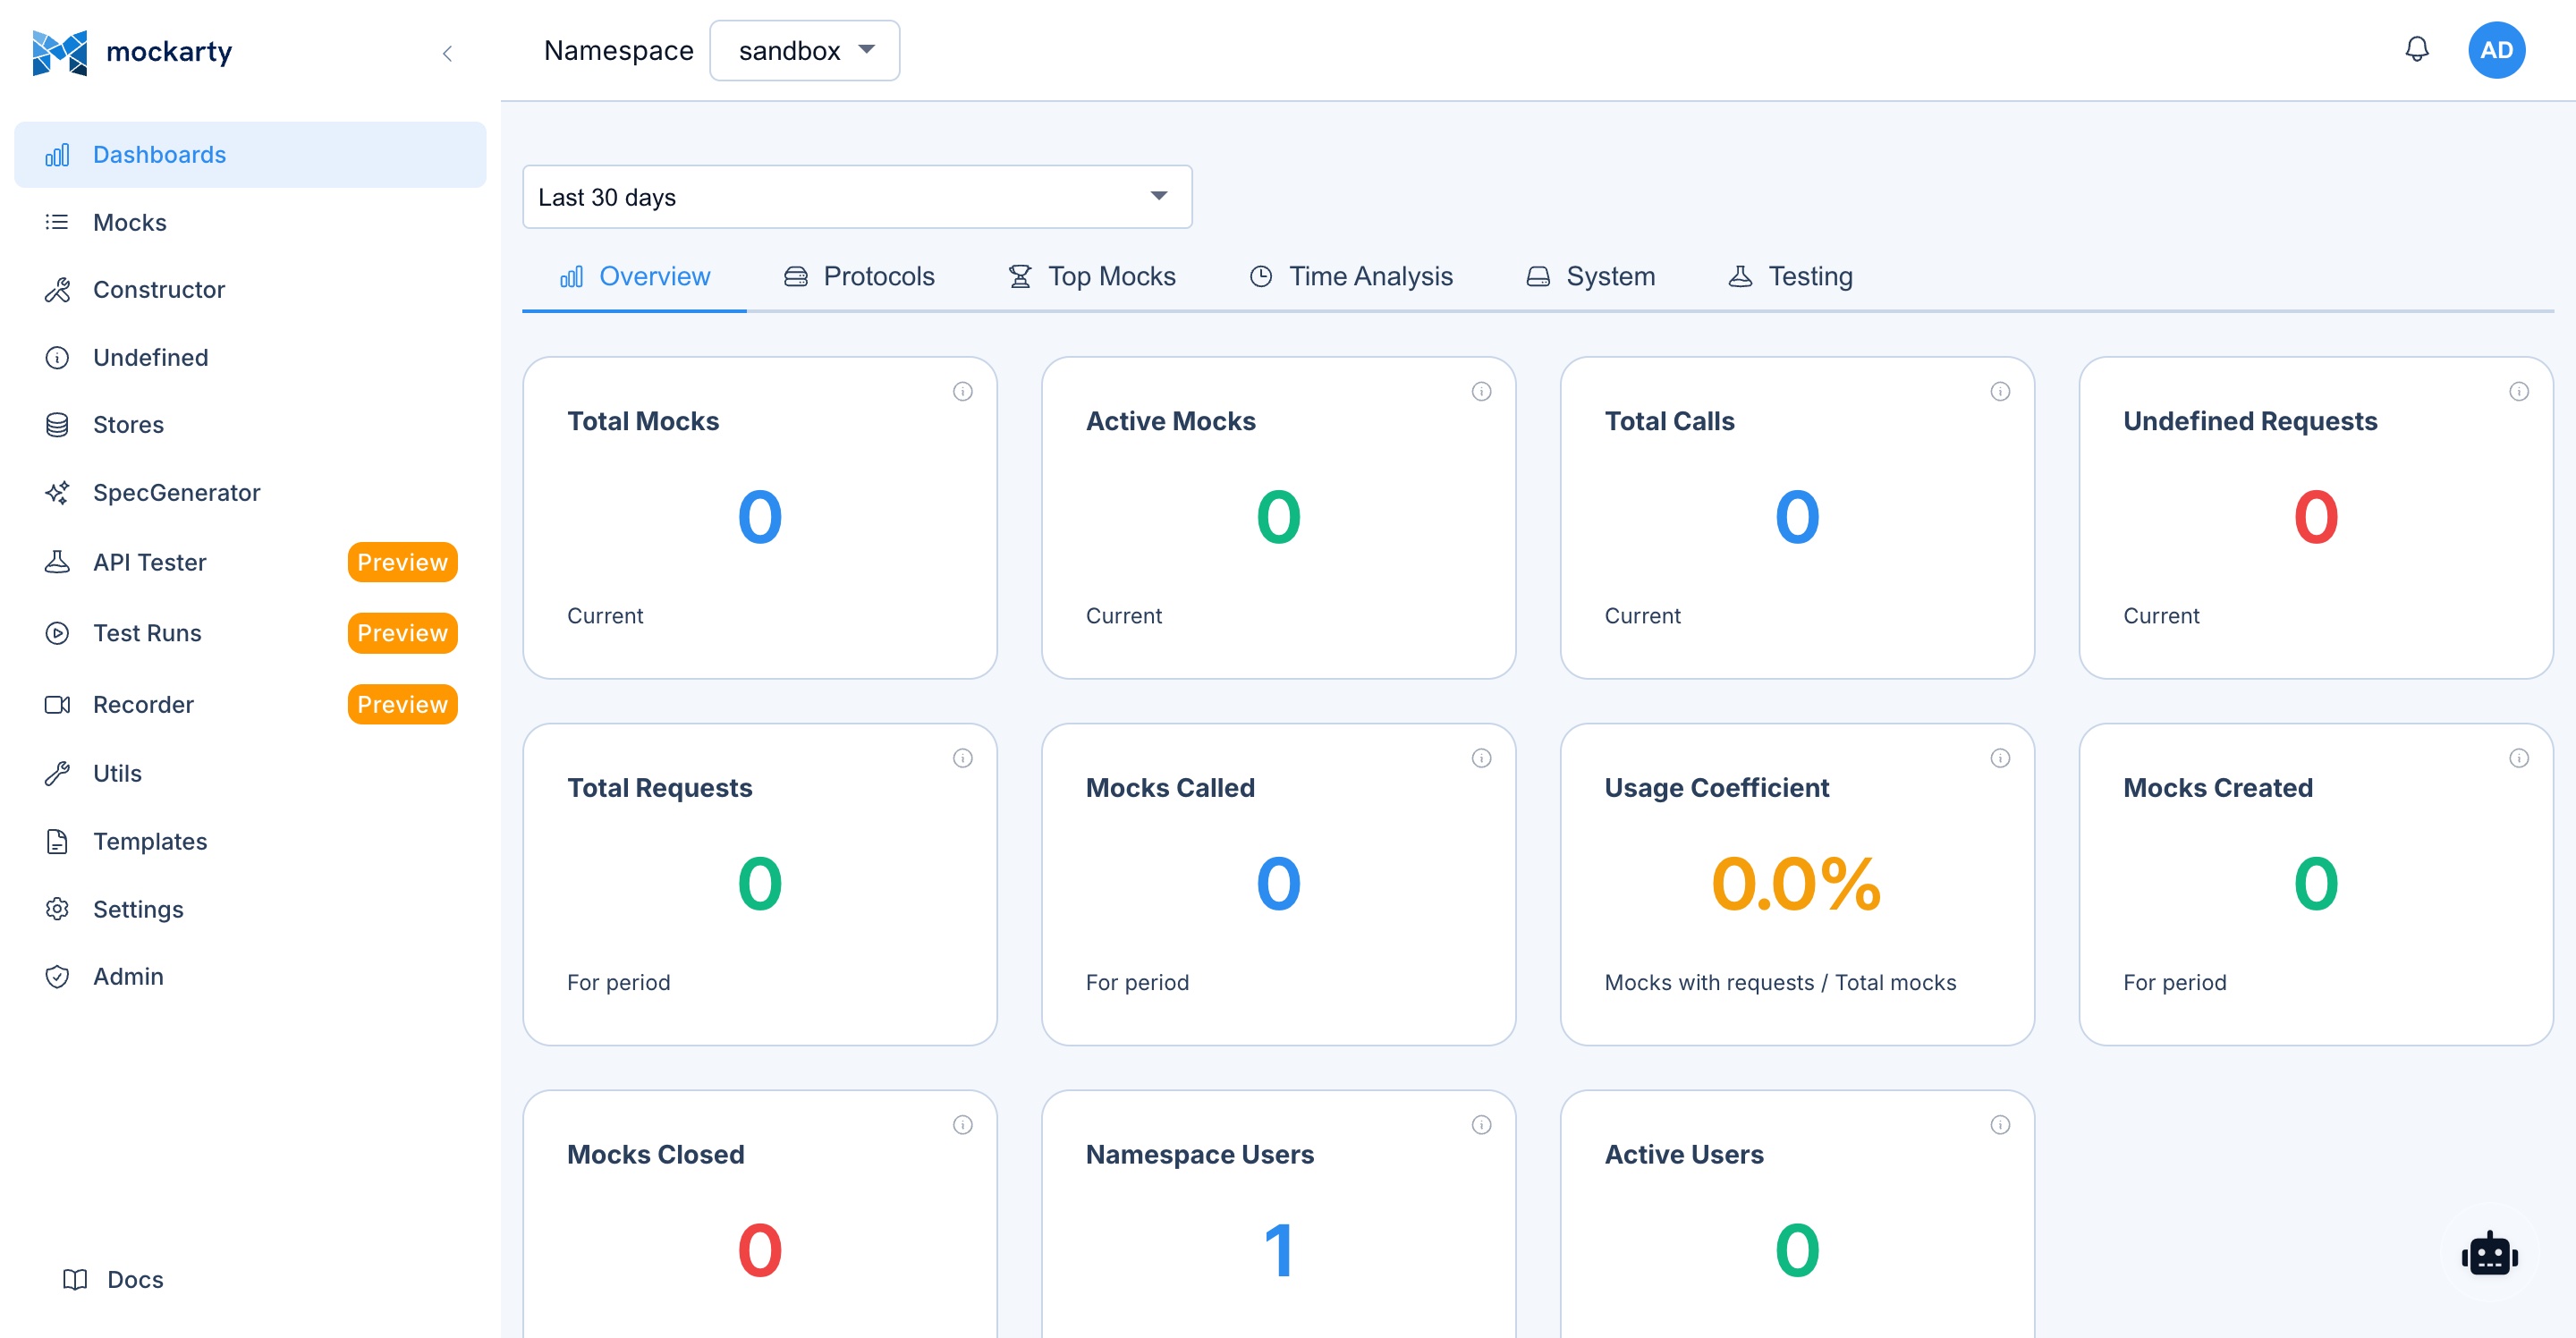
At the top of the dashboard, a row of summary cards shows key metrics at a glance:
- Total Mocks: The number of active mocks in the current namespace.
- Total Requests: The cumulative number of requests resolved by mocks since the last reset.
- Active Namespaces: The number of namespaces with at least one mock.
- Active Users: The number of users who have logged in within the last 30 days.
- Undefined Requests: The number of recent requests that did not match any mock (404s).
- Store Entries: The total number of key-value entries across all stores in the namespace.
Each card shows the current value and a trend indicator (up/down arrow with percentage change compared to the previous period).
Mock Resolution Statistics Chart
A time-series chart shows mock resolution activity over the selected time range (last hour, 24 hours, 7 days, or 30 days). The chart displays:
- Resolved requests (matched a mock and returned a response).
- Unresolved requests (no matching mock found, returned 404).
- Proxy requests (forwarded to a real backend service).
- Error responses (mocks that returned error status codes by design).
You can hover over any point on the chart to see the exact count and timestamp. Click on a series in the legend to toggle its visibility.
Request Volume Trends
A bar chart or line chart (configurable) showing request volume aggregated by hour or day. This helps identify traffic patterns, peak usage times, and anomalies.
Protocol Distribution
A donut chart breaks down mock resolution by protocol type:
- HTTP / REST
- gRPC
- MCP
- GraphQL
- SOAP
- SSE
- WebSocket
- Kafka
- RabbitMQ
- SMTP
This visualization helps understand which protocols are most heavily used in your testing environment.
Top Mocks by Usage
A table listing the most frequently resolved mocks, sorted by request count. Each row shows:
- Mock name and ID.
- Protocol type.
- Route or method.
- Total request count.
- Last resolved timestamp.
Click any row to navigate to the mock detail page.
Mocks
Path: /ui/mocks


The Mocks page is the central hub for browsing, searching, filtering, and managing all mocks in the current namespace.
Browse All Mocks
The main view displays mocks in a list (or card) layout. Each mock entry shows:
- Name: The human-readable mock name.
- ID: The unique mock identifier.
- Protocol: The protocol type (HTTP, gRPC, MCP, etc.) indicated by an icon and label.
- Route / Method: The matched route pattern (e.g.,
/api/users/list) and HTTP method (GET, POST, etc.) or equivalent for other protocols. - Status: Active, disabled, or expired (TTL exceeded or usage limit reached).
- Tags: Color-coded tags for categorization.
- Created / Updated: Timestamps showing when the mock was created and last modified.
- Request Count: The number of times this mock has been resolved.
Search and Filtering
The Mocks page provides powerful search and filtering capabilities:
- Text search: Type in the search box to filter mocks by name, ID, route, or tag. Search is case-insensitive and matches partial strings.
- Protocol filter: Filter by one or more protocol types using the protocol dropdown or filter chips.
- Status filter: Show only active, disabled, or expired mocks.
- Tag filter: Filter by one or more tags. Tags can be combined with AND or OR logic.
- Sort options: Sort by name, creation date, last updated, or request count (ascending or descending).
Folder Organization
Mocks can be organized into folders for better structure:
- Create folder: Click the “New Folder” button to create a folder. Folders can be nested to any depth.
- Move mocks: Drag and drop mocks into folders, or use the context menu to move mocks between folders.
- Rename folder: Double-click a folder name or use the context menu to rename it.
- Delete folder: Deleting a folder moves its contents to the parent folder (mocks are not deleted).
Folders are namespace-scoped and visible to all users in the namespace.
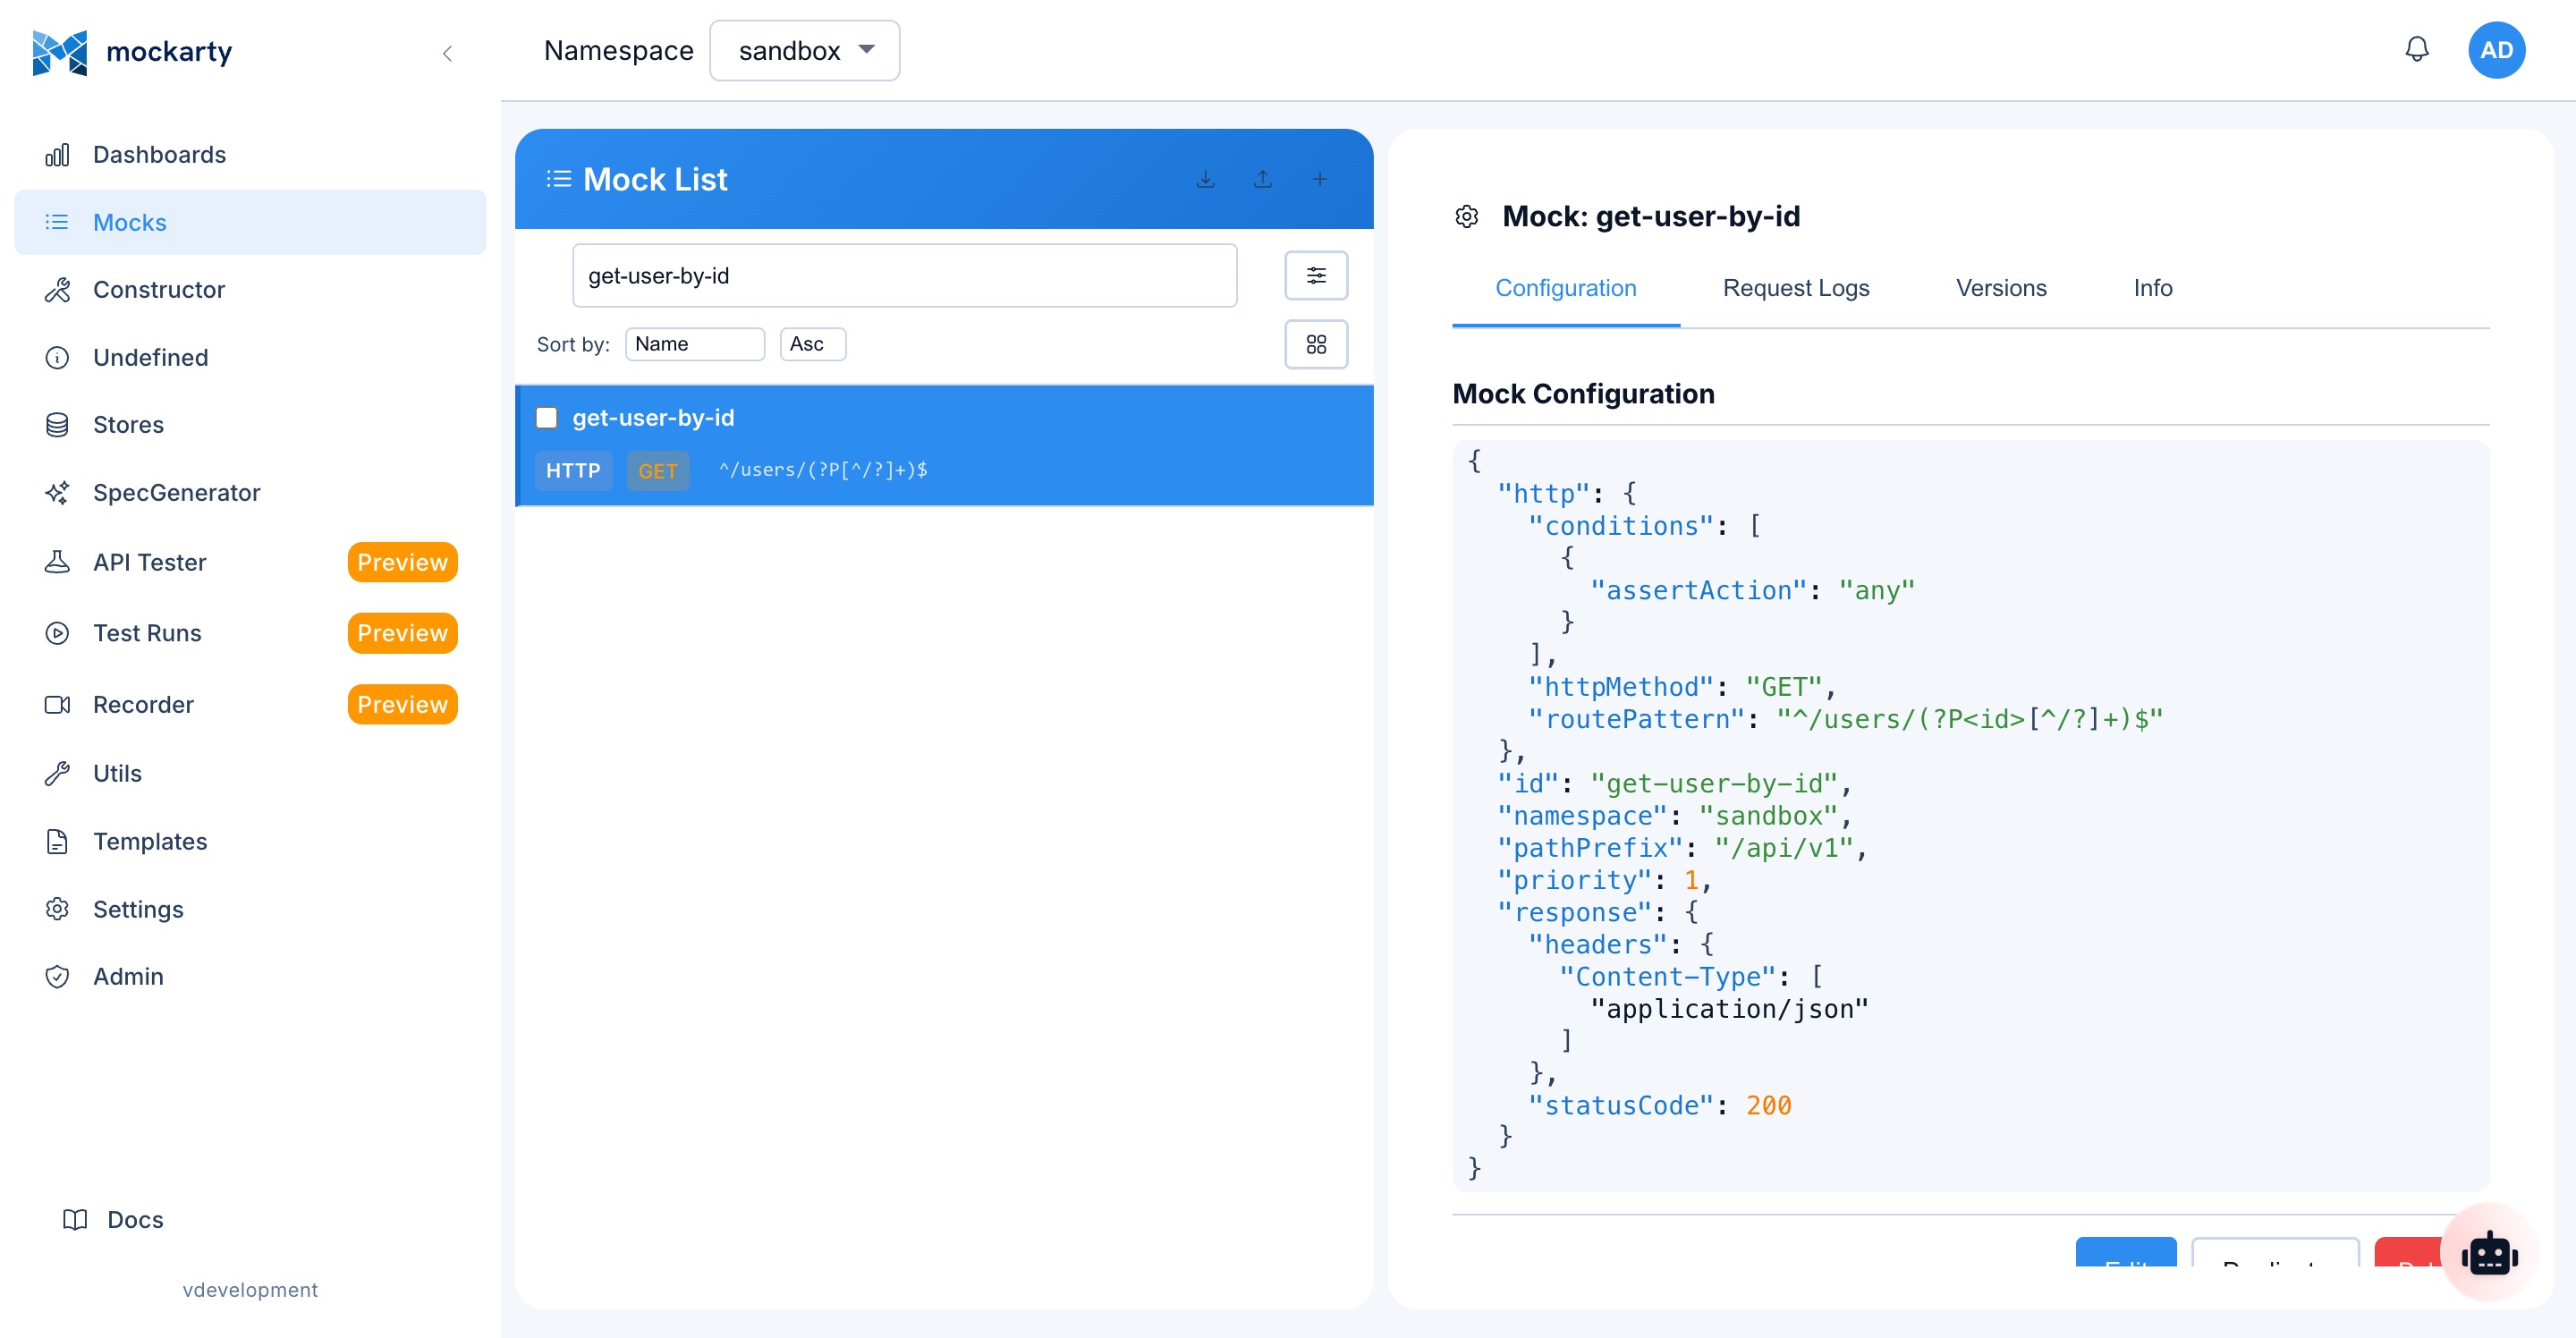
Mock Detail View
Click on any mock to open its detail page. The detail view shows the complete mock configuration organized into tabs:
- Config tab: Protocol-specific settings (route, method, service name, etc.), priority, TTL, usage limits, and proxy configuration.
- Conditions tab: All matching conditions (body, header, query parameter conditions with assert actions).
- Response tab: The response payload, status code, headers, and any OneOf response configurations.
- Extractors tab: Store extractors that capture data from requests into Global, Chain, or Mock stores.
- Logs tab: Recent request logs showing timestamps, request details, and matched conditions.
- History tab: Version history with diff view and rollback capability.
From the detail page you can:
- Edit: Opens the mock in the Constructor for editing.
- Clone: Creates a copy of the mock with a new ID.
- Disable / Enable: Temporarily disable the mock without deleting it.
- Delete: Soft-deletes the mock (can be restored).
- Export: Download the mock configuration as JSON.
Version History and Rollback
Every change to a mock creates a new version. The History tab shows:
- Version number and timestamp.
- The user who made the change.
- A diff view highlighting what changed between versions.
- A “Rollback” button to restore the mock to any previous version.
Rollback creates a new version (it does not delete intermediate versions), so you can always undo a rollback.
Request Logs Per Mock
The Logs tab on the mock detail page shows recent requests that were resolved by this mock:
- Timestamp and duration.
- Request method, path, headers, and body.
- Matched conditions and their evaluation results.
- The response that was returned.
- Store values that were read or written during resolution.
Logs can be filtered by time range and exported as JSON or CSV.
Batch Operations
Select multiple mocks using the checkboxes to perform batch operations:
- Delete: Soft-delete all selected mocks.
- Restore: Restore previously deleted mocks.
- Tag: Add or remove tags from all selected mocks.
- Move: Move selected mocks to a folder.
- Disable / Enable: Toggle the active status of selected mocks.
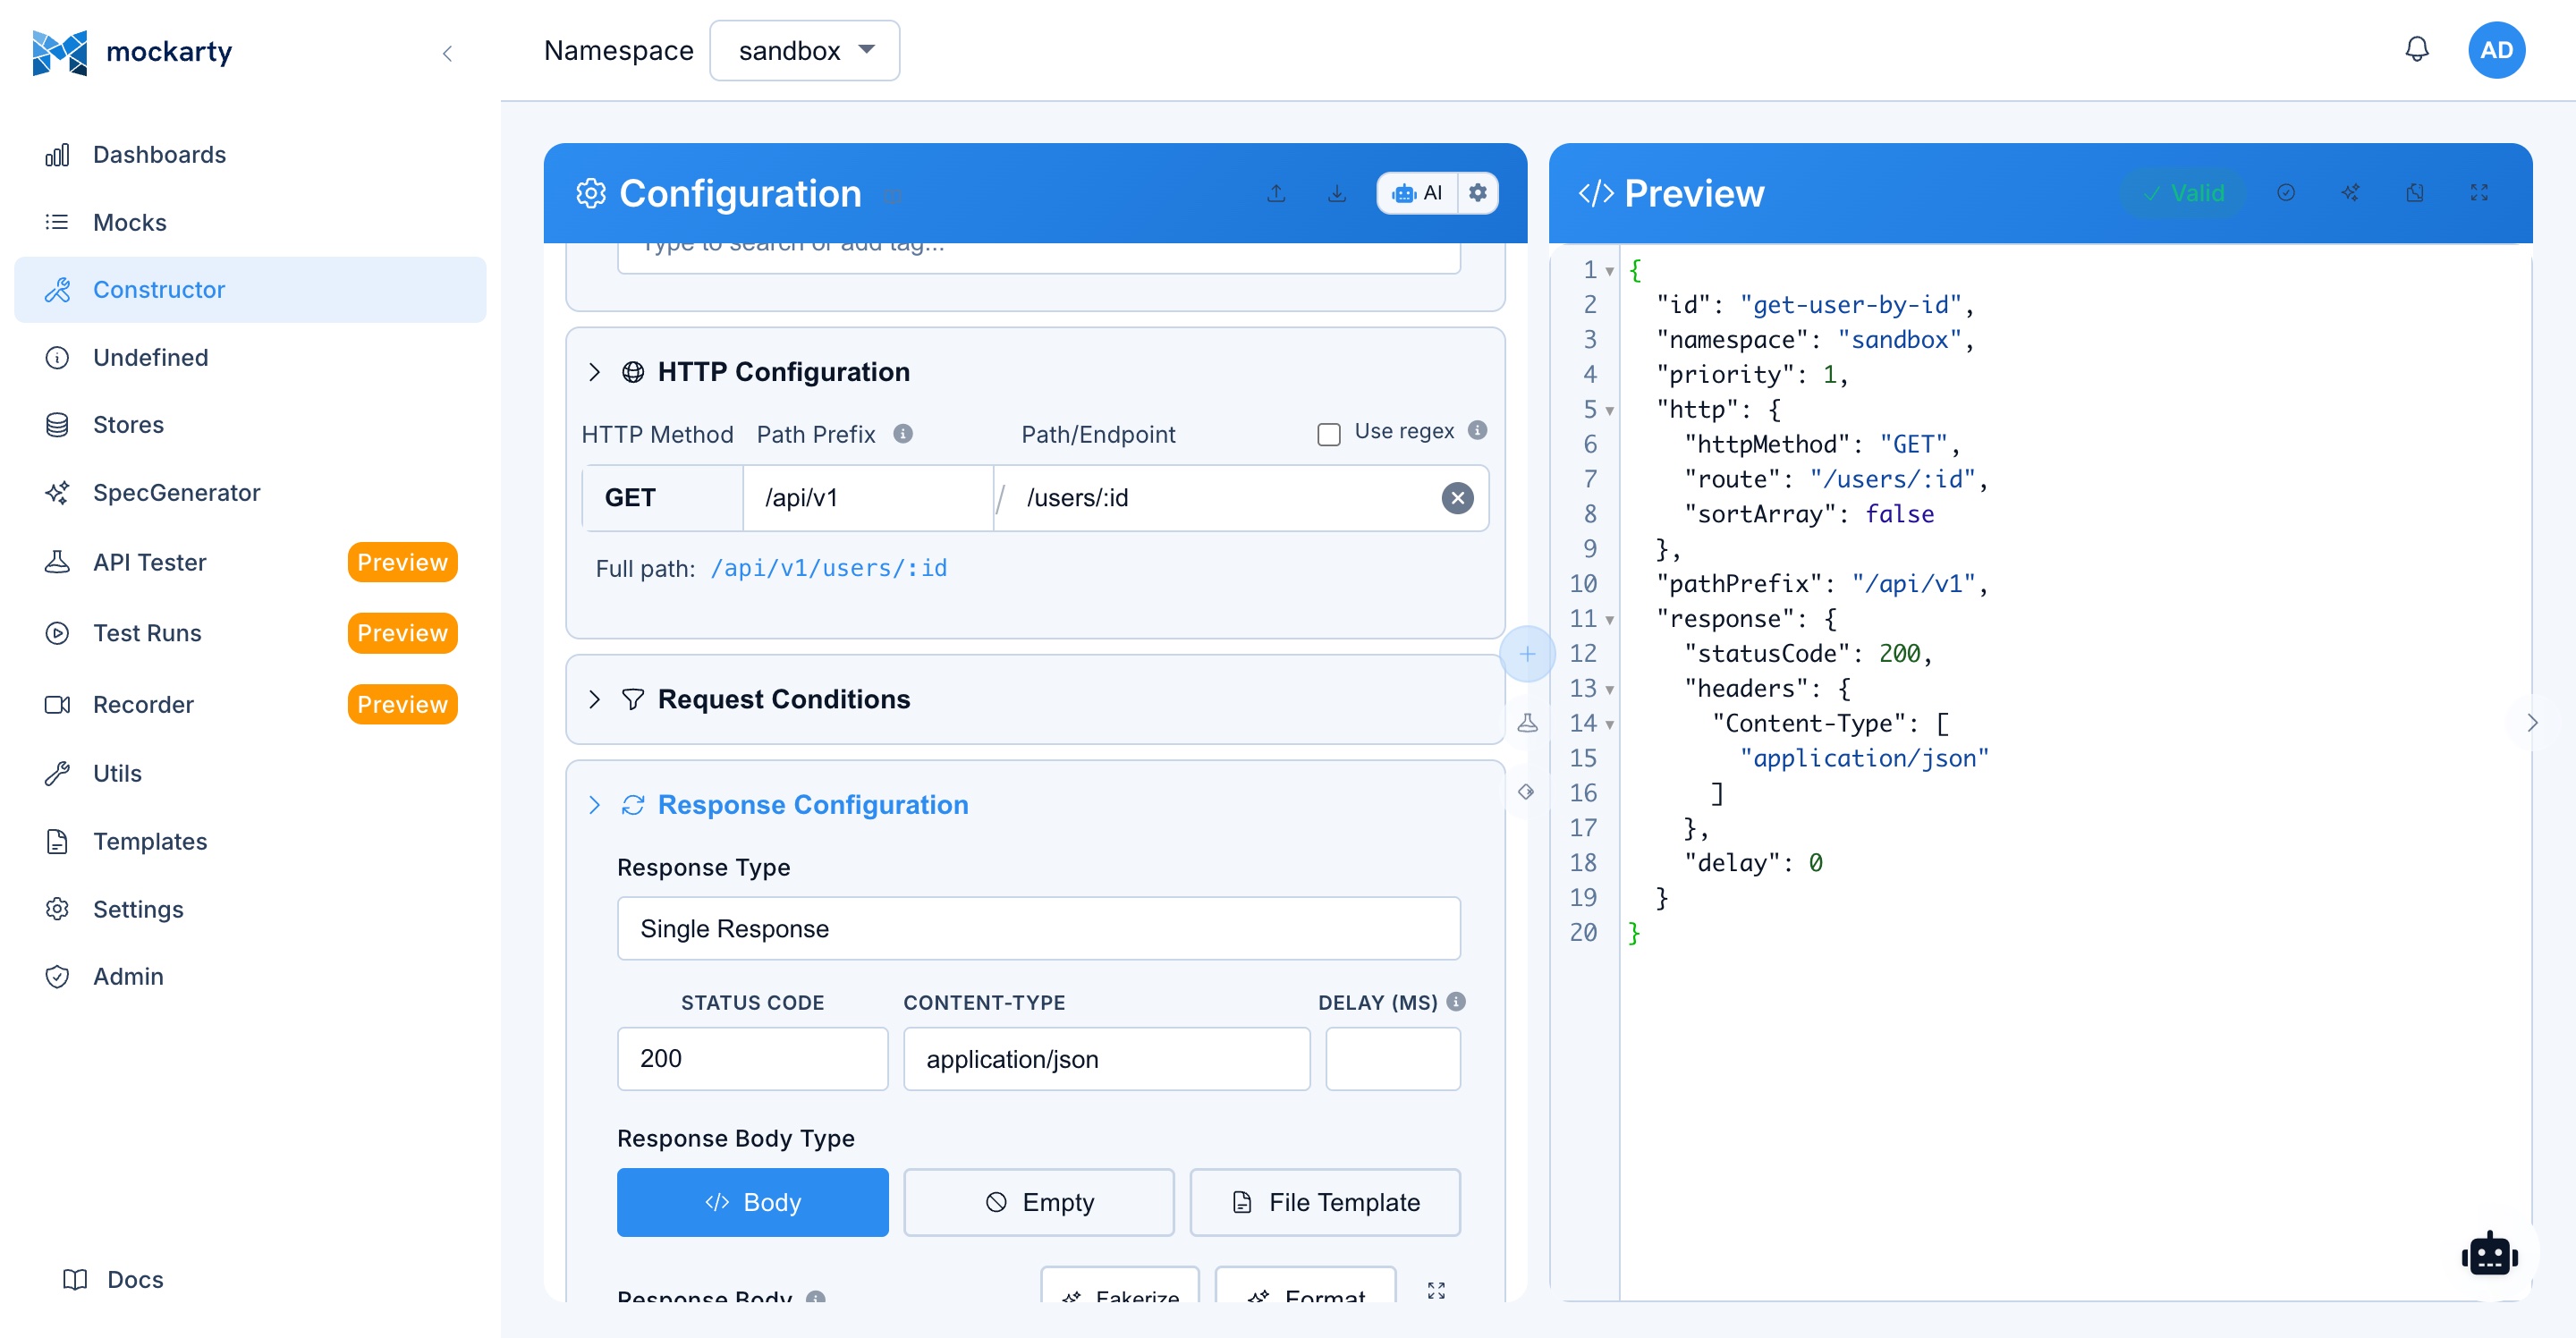
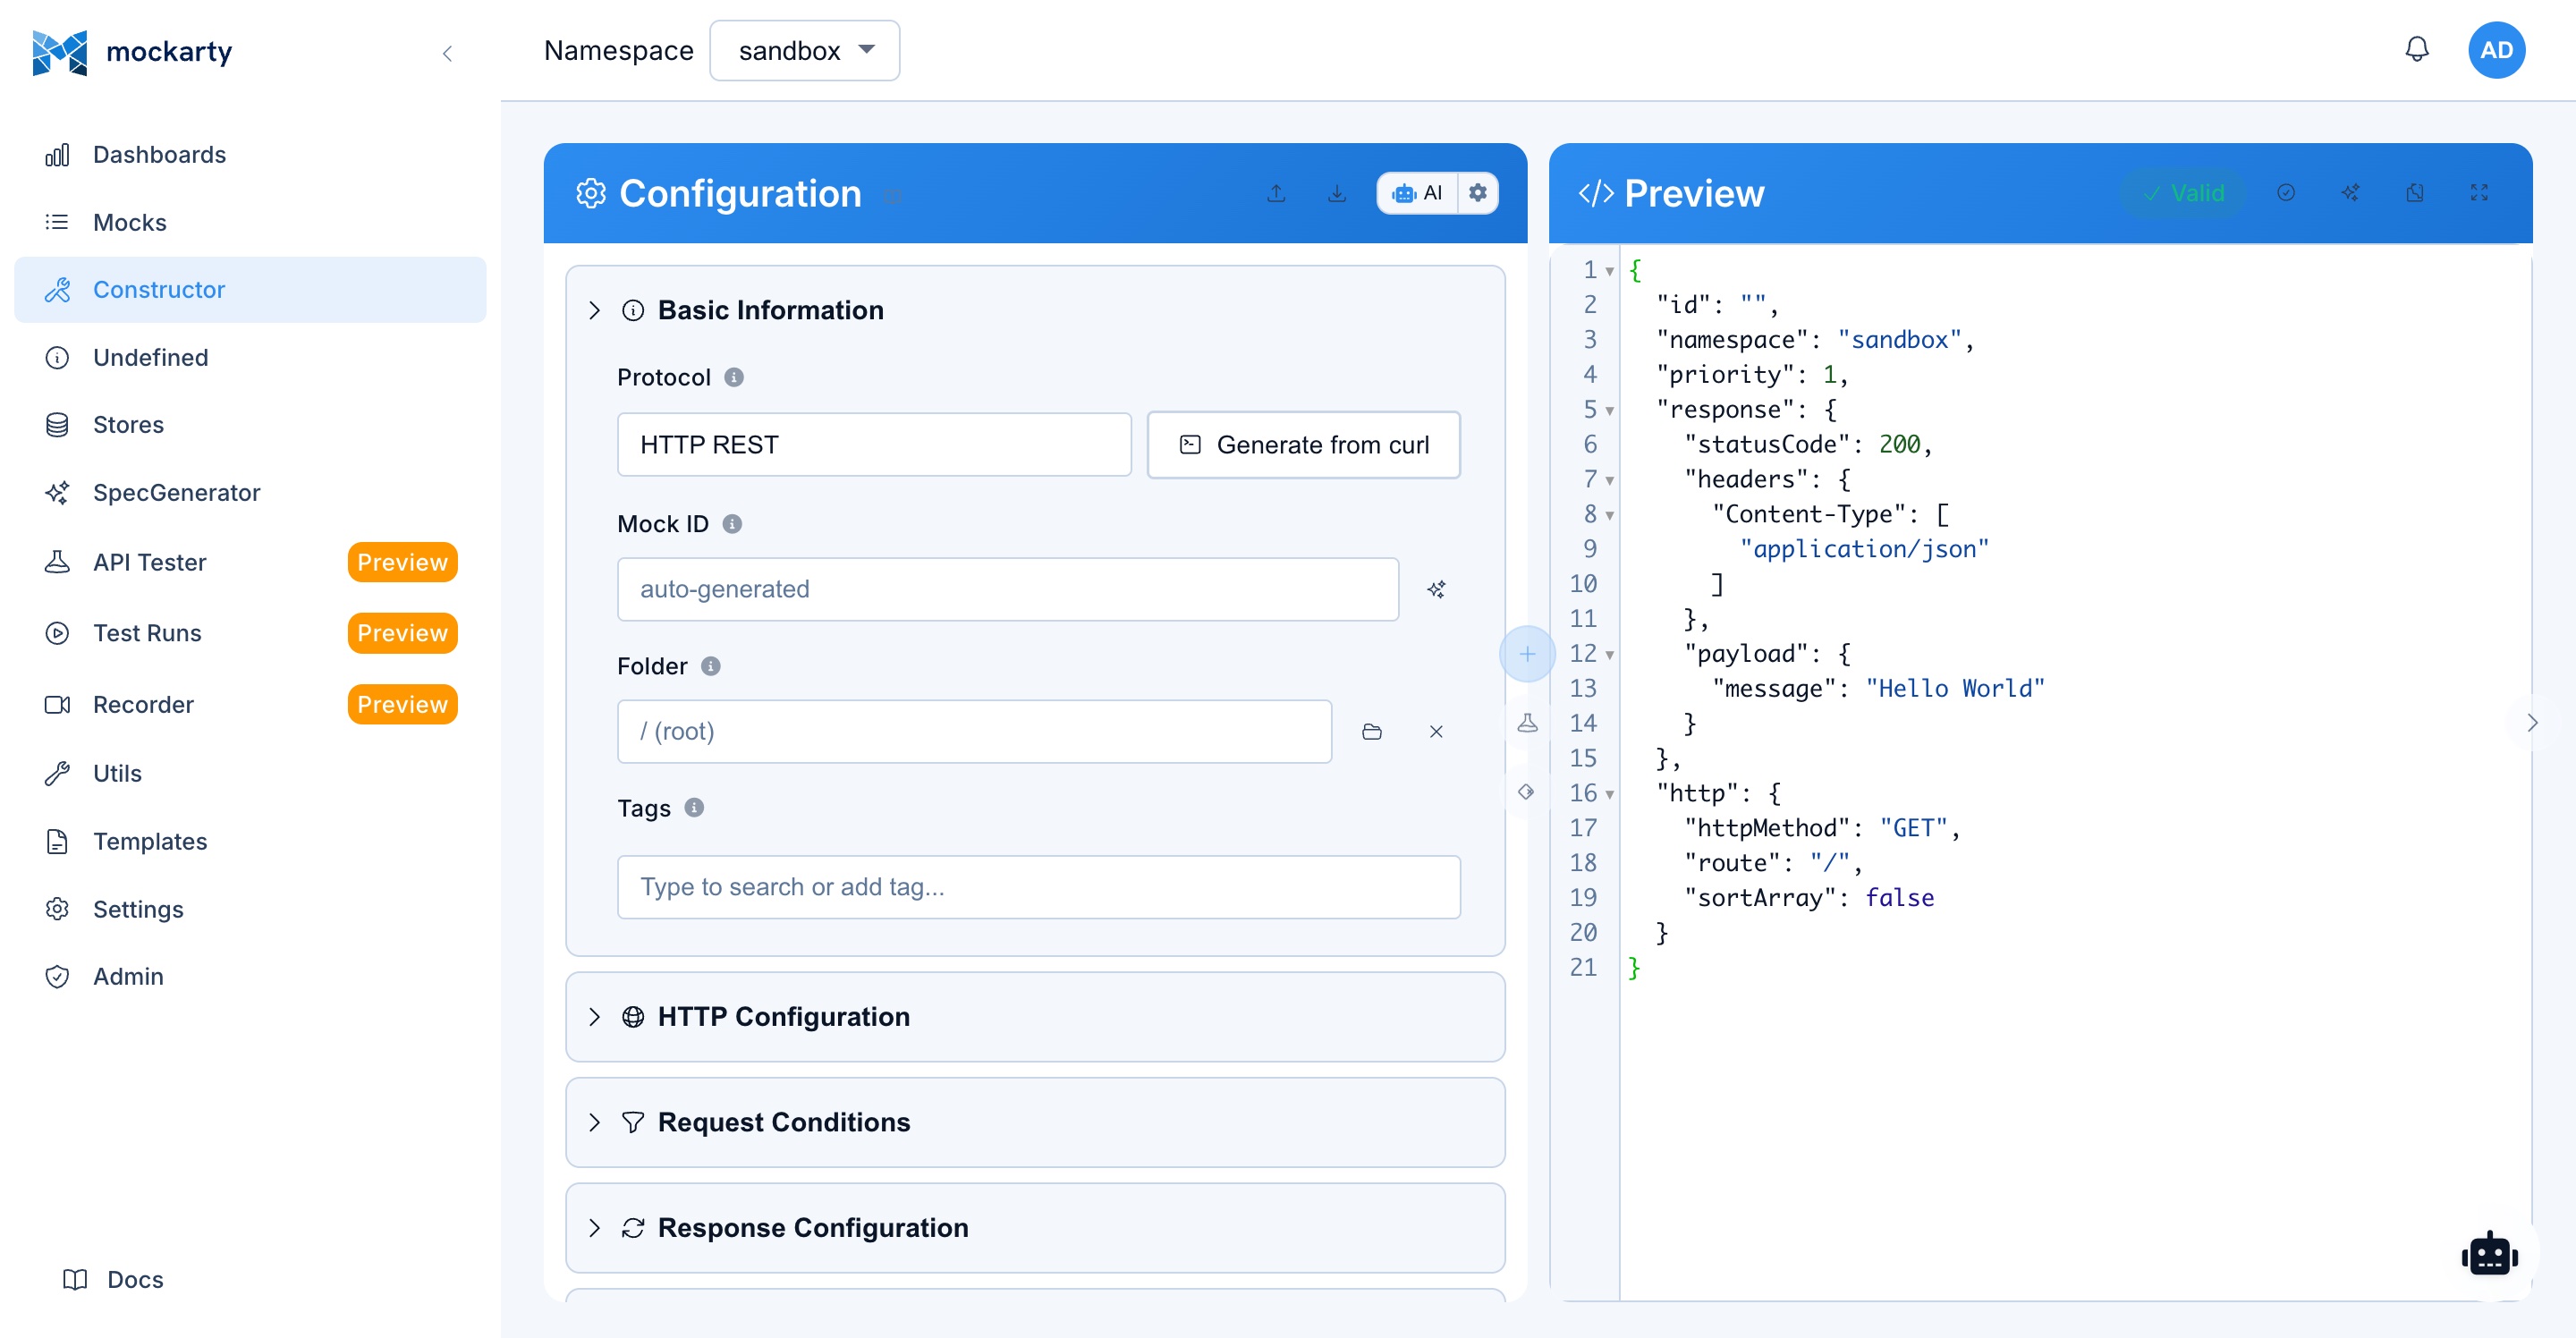
Constructor
Path: /ui/constructor
The Constructor is where you create and edit mocks. Instead of writing JSON by hand, you fill out a guided form: pick a protocol, set the route, define conditions, and craft a response. It is the main tool you will use day to day when working with Mockarty.


AI Feature: Click the Generate Mock button to create a mock from a natural language description, or use Improve Mock to optimize an existing configuration. See AI Features for details.
Protocol Selection
The first step in creating a mock is selecting the protocol. The Constructor supports all protocols that Mockarty can mock:
Direct protocols — served by the Mockarty node at /stubs/{namespace}/...:
- HTTP: RESTful HTTP endpoints with route parameters, query strings, and headers.
- GraphQL: Queries and mutations matched by operation type and name.
- SOAP: SOAP/XML services matched by action and path.
- SSE: Server-Sent Events with event name matching.
- MCP: Model Context Protocol tools, resources, and prompts.
Generated server protocols — mocks are created here in the Constructor, but to serve actual protocol traffic you need to generate and run a standalone server using mockarty-server-generator. The generated server calls back to the Mockarty node for mock resolution. See the Server Generator Guide for details.
- gRPC: Unary and streaming gRPC methods with protobuf payloads.
- Kafka: Topic message payloads, resolved when the Kafka adapter consumes messages from a real Apache Kafka cluster. Scoped by server name. Requires a running Kafka cluster.
- RabbitMQ: Queue/exchange message payloads, resolved when the RabbitMQ adapter consumes from a real RabbitMQ instance. Scoped by server name. Requires a running RabbitMQ.
- Socket: WebSocket, TCP, and UDP communication with event matching.
- SMTP: SMTP email server mocking with sender, recipient, and message content matching.
After selecting a protocol, the Constructor shows protocol-specific configuration fields.
HTTP Mock Configuration
For HTTP mocks, configure the following fields:
- Route: The URL path pattern to match. Supports wildcard segments (e.g.,
/api/users/*) and exact paths. - HTTP Method: The HTTP method to match (GET, POST, PUT, PATCH, DELETE, HEAD, OPTIONS, or ANY for matching all methods).
- Status Code: The HTTP status code to return (e.g., 200, 201, 400, 404, 500).
- Response Headers: Key-value pairs for response headers (Content-Type, Cache-Control, etc.).
- Response Payload: The response body, either as JSON, XML, plain text, or binary data. Supports Faker variables and JsonPath interpolation.
gRPC Mock Configuration
For gRPC mocks:
- Service Name: The fully qualified gRPC service name (e.g.,
mypackage.MyService). - Method Name: The RPC method name (e.g.,
GetUser). - Response Payload: The JSON representation of the protobuf response message. Field names should match the proto definition.
- Error Code: Optional gRPC status code to return (OK, CANCELLED, UNKNOWN, INVALID_ARGUMENT, etc.).
- Error Message: Optional error message when returning a gRPC error.
MCP Mock Configuration
For MCP (Model Context Protocol) mocks:
- Server Name: The MCP server name for routing.
- Tool Name: The name of the MCP tool to mock.
- Input Schema: The JSON Schema describing the tool’s input parameters.
- Response Payload: The tool’s response content, supporting Faker variables and store references.
- Resource URI: For resource-type mocks, the URI pattern to match.
- Prompt Name: For prompt-type mocks, the prompt identifier.
GraphQL Mock Configuration
For GraphQL mocks:
- Operation Type: Query, Mutation, or Subscription.
- Operation Name: The named operation to match (optional; if omitted, matches any operation of the specified type).
- Response Payload: The GraphQL response body in standard
{ "data": { ... } }format. - Error Responses: Configure GraphQL-specific error responses with
{ "errors": [ ... ] }.
SOAP Mock Configuration
For SOAP mocks:
- SOAP Action: The SOAPAction header value to match.
- Path: The endpoint path to match.
- Response Payload: The XML response envelope. Supports Faker variables within XML elements.
- WSDL: Optional WSDL content for validation and auto-completion.
Kafka Mock Configuration
For Kafka mocks:
- Topic: The Kafka topic name to match.
- Server Name: The logical server name for routing (scopes the mock to a specific Kafka server instance).
- Response Payload: The message value to return, supporting JSON or plain text with Faker interpolation.
- Key: Optional message key.
- Headers: Optional Kafka message headers.
RabbitMQ Mock Configuration
For RabbitMQ mocks:
- Queue / Exchange: The queue or exchange name to match.
- Routing Key: The routing key pattern.
- Server Name: The logical server name for routing.
- Response Payload: The message body to return.
- Headers: Optional AMQP message headers.
SSE Mock Configuration
For SSE (Server-Sent Events) mocks:
- Event Name: The SSE event type to match.
- Server Name: The logical server name for routing.
- Response Payload: The event data to send.
- Retry: Optional reconnection interval in milliseconds.
- ID: Optional event ID for client-side tracking.
Socket Mock Configuration
For WebSocket and raw socket mocks:
- Server Name: The logical server name for routing (identifies which generated Socket server handles this mock).
- Event Name: The event name to match (for WebSocket/TCP/UDP message routing).
- Response Payload: The message to send back, supporting JSON or text.
SMTP Mock Configuration
For SMTP mocks:
- Server Name: The logical SMTP server name for routing.
- Sender (From): The sender email address pattern to match.
- Recipient (To): The recipient email address pattern to match.
- Subject: The email subject line to match.
- Response Payload: The SMTP response to return, supporting Faker variables and store references.
Conditions Tab
Conditions determine when a mock should be selected for a given request. Multiple conditions can be combined (all conditions must match for the mock to be selected – AND logic).
Body Conditions (JsonPath)
Match against specific fields in the request body using JsonPath expressions:
-
JsonPath: The path expression to evaluate against the request body (e.g.,
$.user.name,$.items[0].id). -
Assert Action: The comparison operation. Mockarty supports 13 assert actions:
Action JSON value Description Example Equals equalsExact match. For strings, compares literally. For objects and arrays, performs deep equality comparison. $.user.roleequals"admin"Contains containsFor strings – substring match. For objects – checks that the expected fields are a subset of the actual object. For arrays – checks that the expected element is present. $.user.namecontains"john"Not Equals not_equalsNegation of equals. Matches when the value does NOT equal the expected value.$.statusnot_equals"deleted"Not Contains not_containsNegation of contains. Matches when the value does NOT contain the expected substring or subset.$.tagsnot_contains"deprecated"Any anyAlways matches regardless of the actual value. Acts as a wildcard – the expected value is ignored. $.request_idanyNot Empty notEmptyMatches when the value is non-empty: non-null, non-empty string, non-empty array, or non-empty object. $.user.emailnotEmptyEmpty emptyMatches when the value is empty: null, empty string "", empty array[], or empty object{}.$.erroremptyMatches matchesRegular expression pattern matching against the string value. The expected value is the regex pattern. $.emailmatches"^[a-z]+@example\\.com$"Is Number is_numberMatches when the value is numeric. $.amountis_numberNum Digits num_digitsMatches when the string has the expected number of digits. $.codenum_digits6Starts With starts_withMatches when the string starts with the expected prefix. $.skustarts_with"PRD-"Ends With ends_withMatches when the string ends with the expected suffix. $.fileends_with".pdf"One Of one_ofMatches when the value is one of the expected list. $.statusone_of["active","trial"]Note: The legacy alias
matchis also accepted and behaves identically tomatches. -
Expected Value: The value to compare against.
Header Conditions
Match against request headers:
- Header Name: The HTTP header name (case-insensitive for HTTP, case-sensitive for gRPC metadata).
- Assert Action: Same options as body conditions.
- Expected Value: The header value to compare against.
Query Parameter Conditions
Match against URL query parameters (HTTP only):
- Parameter Name: The query parameter key.
- Assert Action: Same options as body conditions.
- Expected Value: The parameter value to compare against.
You can add multiple conditions of each type. All conditions must be satisfied for the mock to match.
Advanced Condition Fields (API Only)
When creating conditions via the REST API (not in the web UI), each condition object supports additional fields:
| Field | Type | Description |
|---|---|---|
decode |
string | Set to "base64" to base64-decode the extracted value before comparison. Useful when the request contains base64-encoded fields. |
sortArray |
bool | Sort arrays before comparison. Overrides the global sortArray flag on the protocol config for this specific condition. |
valueFromFile |
string | Path to a file whose content is used as the condition value instead of value. The path supports template processing ($.fake.*, store references). Takes precedence over value when set. |
Example via API:
{
  "path": "$.data",
  "assertAction": "equals",
  "value": "expected",
  "decode": "base64",
  "sortArray": true,
  "valueFromFile": "/templates/expected-response.json"
}
Note:
decode,sortArray, andvalueFromFileare not exposed in the web UI constructor. Use the REST API (POST /api/v1/mocks) to set these fields.
Response Tab
The Response tab provides a rich editor for crafting the mock response:
Payload Editor
A code editor (with syntax highlighting for JSON and XML) for writing the response payload. The editor supports:
-
Faker variables: Insert dynamic data using
$.fake.*expressions. For example:$.fake.UUID– generates a random UUID.$.fake.FirstName– generates a random first name.$.fake.Email– generates a random email address.$.fake.Number– generates a random integer.- See the Faker Functions Reference for the complete list.
-
JsonPath interpolation: Reference data from the incoming request (see the JsonPath Guide for full syntax):
$.req.fieldName– extract a field from the request body.$.queryParams.page– extract a query parameter.$.reqHeader.Authorization[0]– extract a request header.
-
Store references: Access values from any of the three store types (see Store Systems for details):
$.gS.keyName– read from the Global Store.$.cS.keyName– read from the Chain Store.$.mS.keyName– read from the Mock Store.
-
Math and logic operations: Compute values dynamically:
$.sum(a, b)– addition.$.multiply(a, b)– multiplication.$.increment(key)– atomically increment a store counter.$.subtract(expr1, expr2)– subtract expr2 from expr1 (e.g.$.subtract($.gS.counter, 1)to decrement).
Status Code
Set the HTTP status code (or gRPC status code for gRPC mocks). The UI provides a dropdown with common codes and their descriptions.
Response Headers
Add custom response headers as key-value pairs. Common headers can be selected from a dropdown for convenience.
Response Delay
Configure an artificial delay (in milliseconds) before sending the response. Useful for simulating slow services and testing timeout handling.
OneOf Responses
Mocks can define multiple response variants that are returned either in sequence or randomly:
- Ordered: Responses are returned in the defined order, cycling back to the first after all have been used. Useful for simulating state changes (e.g., first call returns “pending”, second returns “completed”).
- Random: A random response is selected for each request. Useful for simulating flaky services or variable behavior.
Each response variant has its own payload, status code, headers, and delay configuration. Add variants using the “Add Response” button in the Response tab.
Proxy Mode
Instead of returning a static or template-based response, a mock can proxy the request to a real backend service:
- Target URL: The base URL of the backend service to forward requests to.
- Response Delay: Configure an artificial delay on the Response tab (in milliseconds) to simulate network latency or slow processing. This applies to both static and proxied responses.
- Response Headers: Override or add specific headers via the Response tab — useful for adjusting CORS, adding tracing headers, or modifying auth tokens on the proxied response.
- Record passthrough traffic: When enabled, every proxied request and its real upstream response are captured into Undefined Requests. From there a captured call converts into a real mock in one click — the mock is created with the observed method, route, query/body match conditions, and the real response pre-filled. Capture works for HTTP, SOAP, GraphQL, gRPC, and MCP proxy mocks.
Proxy mode is useful for:
- Recording and comparing real vs mocked responses.
- Testing timeout behavior (add delay to real responses).
- Adding toxicity to real services (intermittent errors, slow responses).
- Recording real responses while they pass through.
- Modifying response headers without changing the backend.
Store Extractors
Store extractors capture data from incoming requests and save it to one of the three store types for later use:
- Global Store (gS): Namespace-scoped persistent state. Values persist across requests and mocks. Ideal for counters, feature flags, and shared state.
- Chain Store (cS): Request-chain scoped state. Values persist across related mocks in a workflow (e.g., create -> get -> update). Linked by a chain ID.
- Mock Store (mS): Per-request ephemeral state. Values exist only during the processing of a single mock resolution. Useful for intermediate calculations.
For each extractor, configure:
- Source: Where to extract from (body, header, query parameter, path parameter).
- JsonPath: The JsonPath expression to evaluate (for body extraction).
- Store Type: gS, cS, or mS.
- Key: The key under which to store the extracted value.
TTL and Usage Limits
Control the lifecycle of a mock:
- TTL (Time to Live): The mock automatically expires after the specified duration (e.g., 1 hour, 24 hours, 7 days). After expiration, the mock no longer resolves requests. Useful for temporary test scenarios.
- Usage Limit: The mock expires after being resolved the specified number of times. After reaching the limit, subsequent requests are not matched. Useful for one-shot test scenarios.
When a mock expires (by TTL or usage limit), it remains visible in the Mocks list with an “expired” status badge. It can be manually re-enabled or deleted.
Priority Setting
When multiple mocks match the same request, priority determines which one is selected:
- Higher priority values take precedence.
- Default priority is 0.
- Mocks with conditions are typically given higher priority than catch-all mocks.
- Priority is particularly important when using broad route patterns alongside specific ones.
Tags
Tags provide a flexible categorization system:
- Add one or more tags to any mock using the tag input field.
- Tags are color-coded for visual distinction.
- Use tags for cross-cutting concerns (e.g., “payment”, “v2”, “regression”, “flaky”).
- Filter mocks by tag on the Mocks page.
- Batch-apply tags using the batch operations feature.
Undefined Requests
Path: /ui/undefined
The Undefined Requests page shows all incoming requests that did not match any mock and received a 404 response. This is invaluable for discovering missing mocks and understanding what your consumers expect.
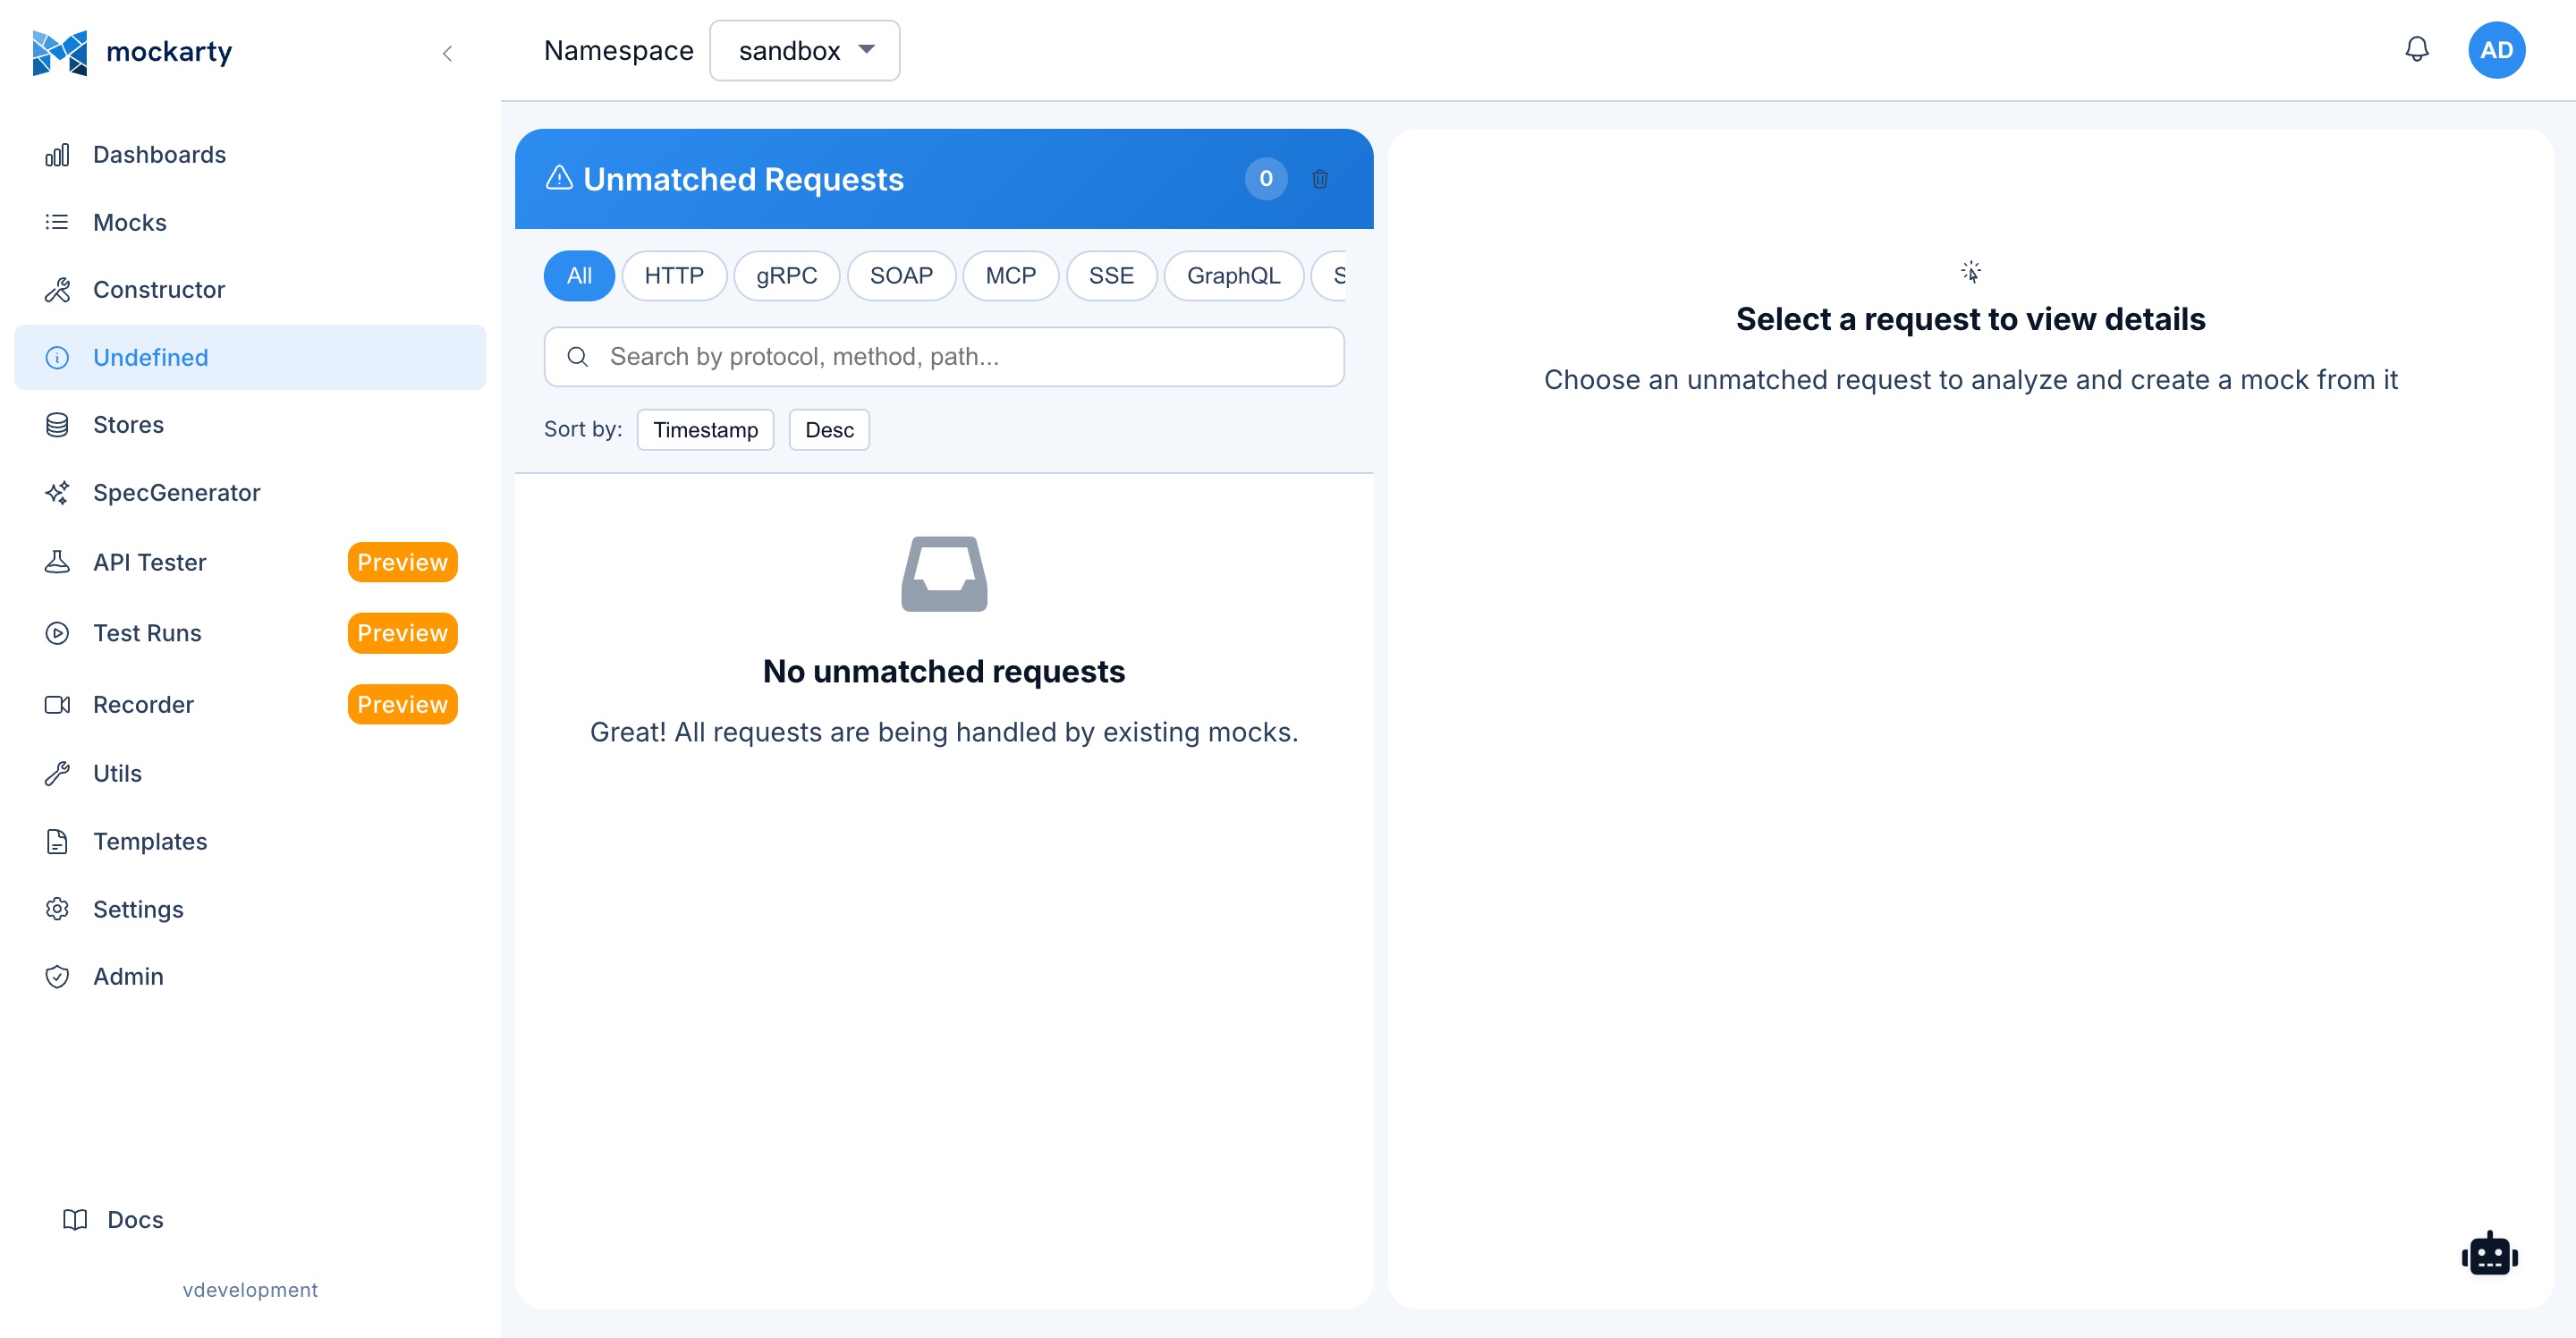

Request List
The main view shows undefined requests in a table with:
- Timestamp: When the request was received.
- Method: The HTTP method (or protocol-specific equivalent).
- Path / Route: The requested URL path.
- Source IP: The client’s IP address.
- Headers: Key request headers (Content-Type, Authorization, etc.).
- Count: How many times this exact request pattern has been seen.
Requests are grouped by method + path to reduce noise. The count shows how frequently each pattern occurs.
Request Details
Click on any undefined request to see the full details:
- Complete request headers.
- Full request body (formatted for JSON/XML).
- Query parameters.
- Path parameters (if the URL matches a known pattern).
- Metadata (for gRPC/MCP requests).
Create Mock from Undefined Request
The most powerful feature of the Undefined Requests page: click the “Create Mock” button on any undefined request to open the Constructor pre-populated with:
- The request’s route pattern (with detected path parameters).
- The HTTP method.
- A suggested response payload based on the request structure.
- Any detected conditions from the request body.
This workflow dramatically speeds up the process of closing coverage gaps.
Ignore Requests
For requests you do not want to mock (health checks from load balancers, monitoring probes, etc.), click “Ignore” to suppress them from the list. Ignored patterns can be managed in the Settings page.
Bulk Clear
Use the “Clear All” button to remove all undefined requests from the list. This is useful after a bulk import or when you have addressed all coverage gaps. Clearing is permanent and cannot be undone.
Stores
Path: /ui/stores
Stores let your mocks remember data between requests. For example, a “create order” mock can save the new order ID, and a “get order” mock can return it later. This is what makes Mockarty capable of simulating realistic, multi-step workflows rather than just returning static responses.
The Stores page provides a unified interface for managing all three store types. For comprehensive documentation on store behavior and usage patterns, see the Store Systems reference.
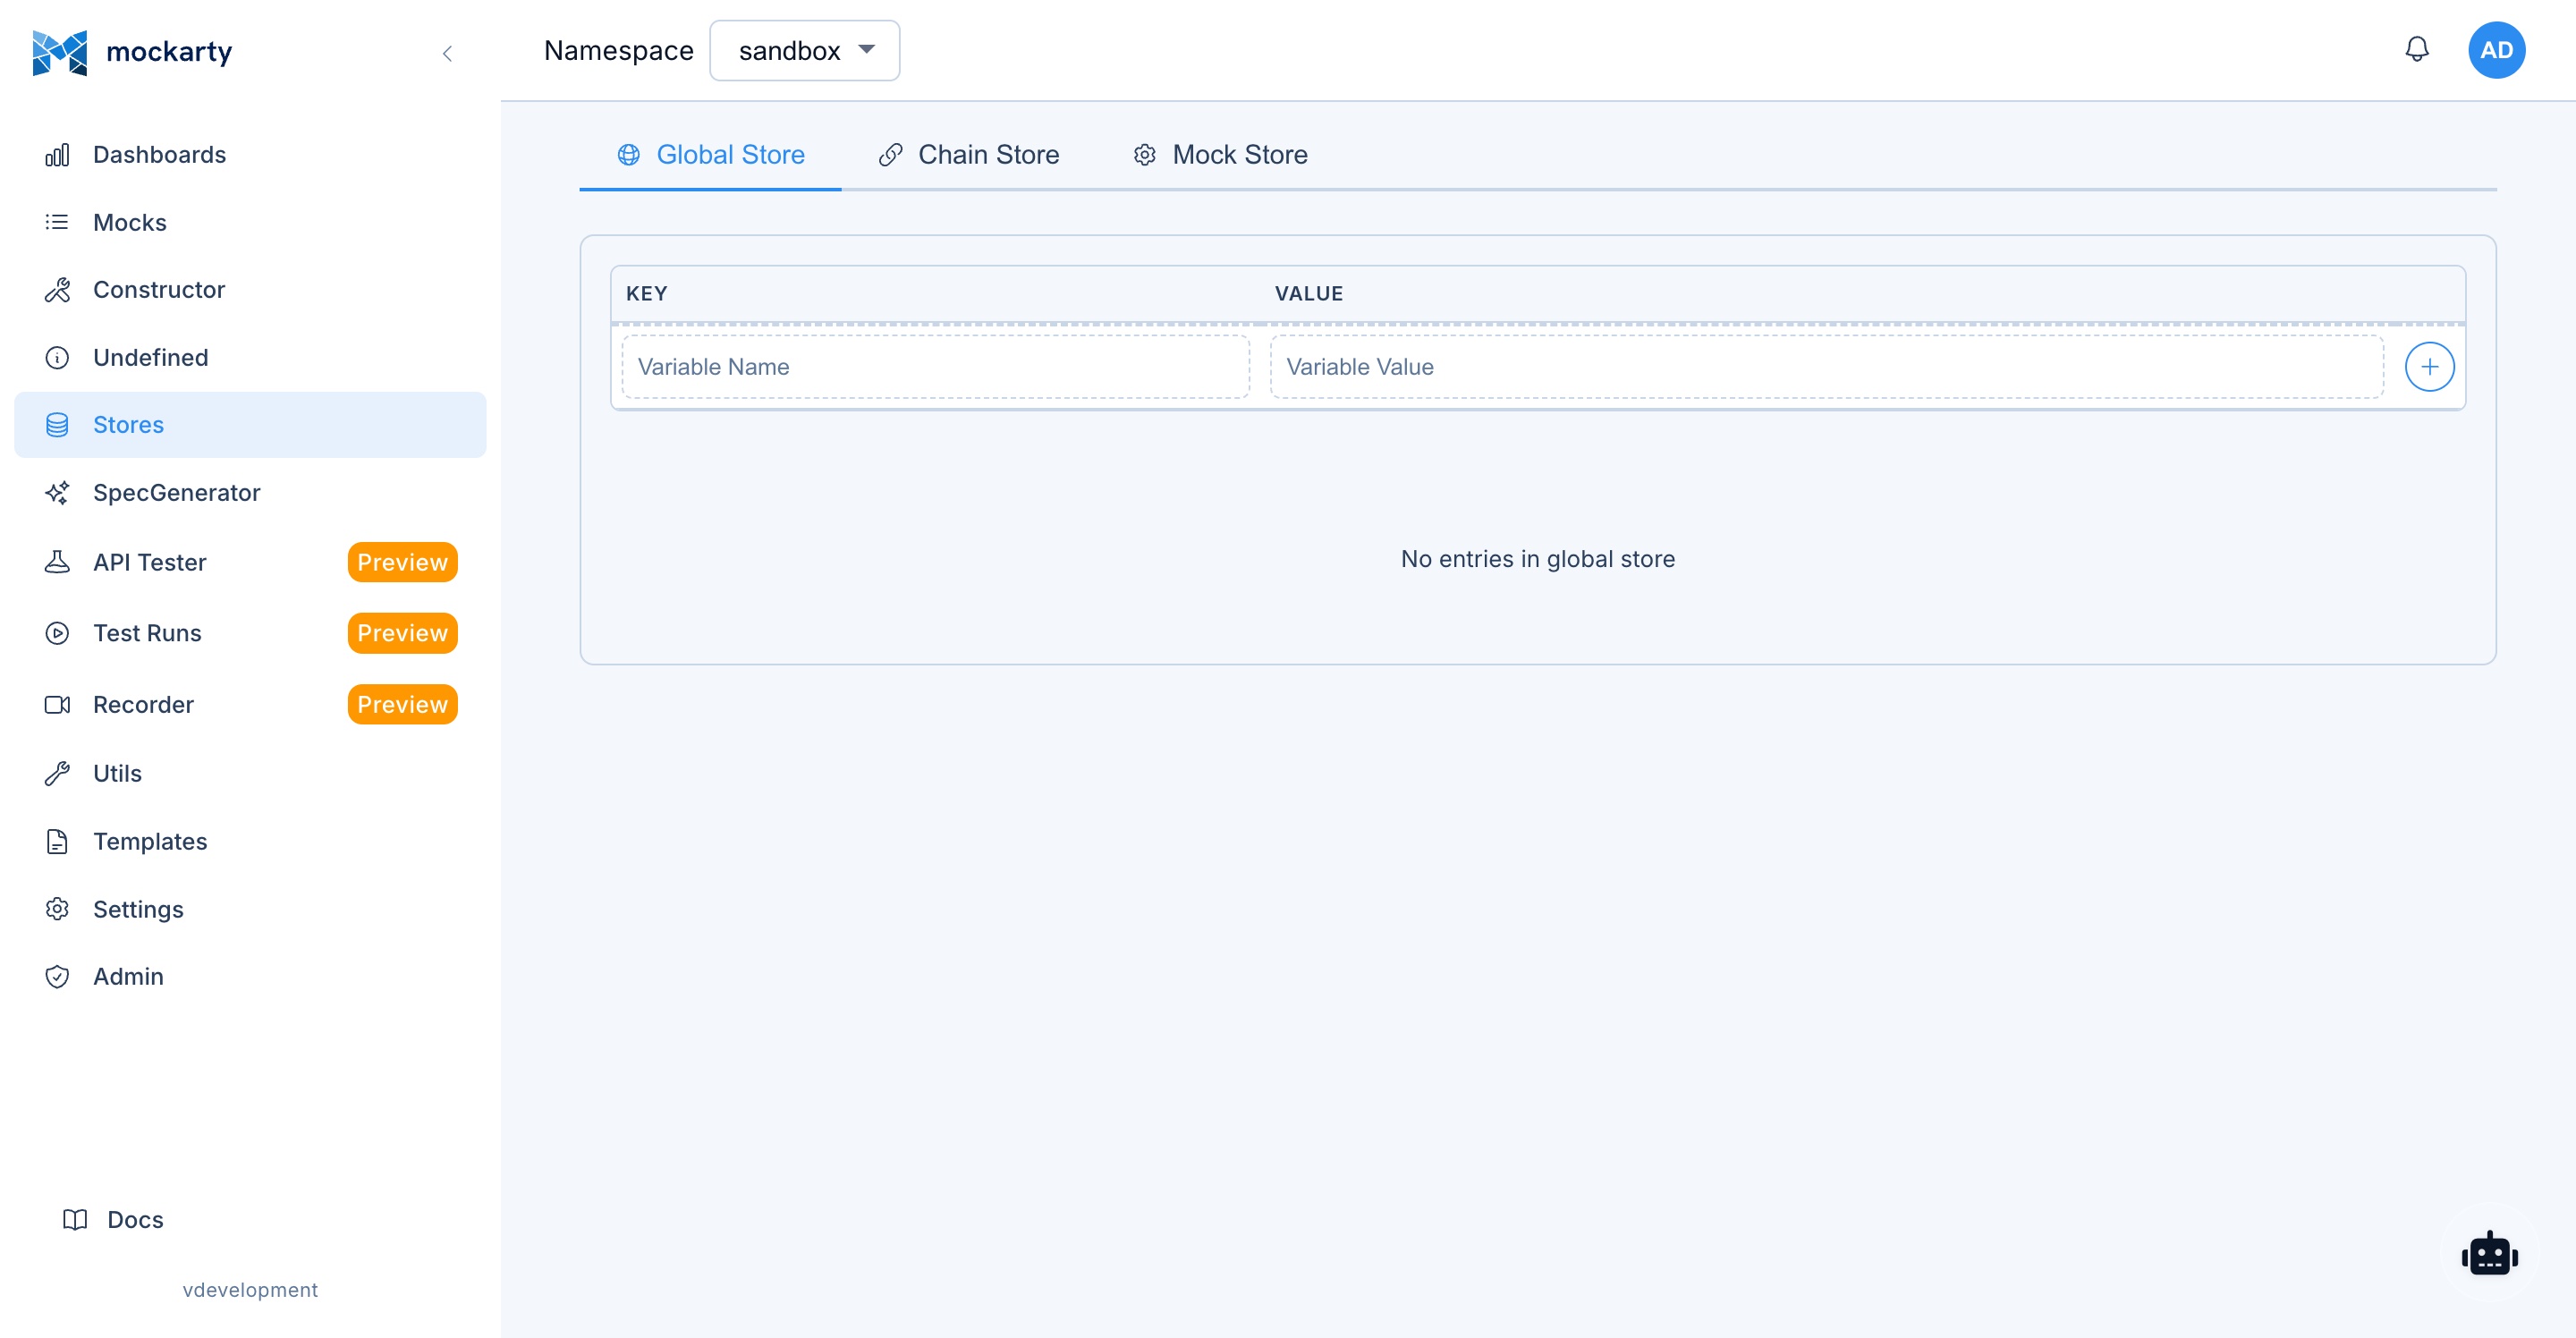
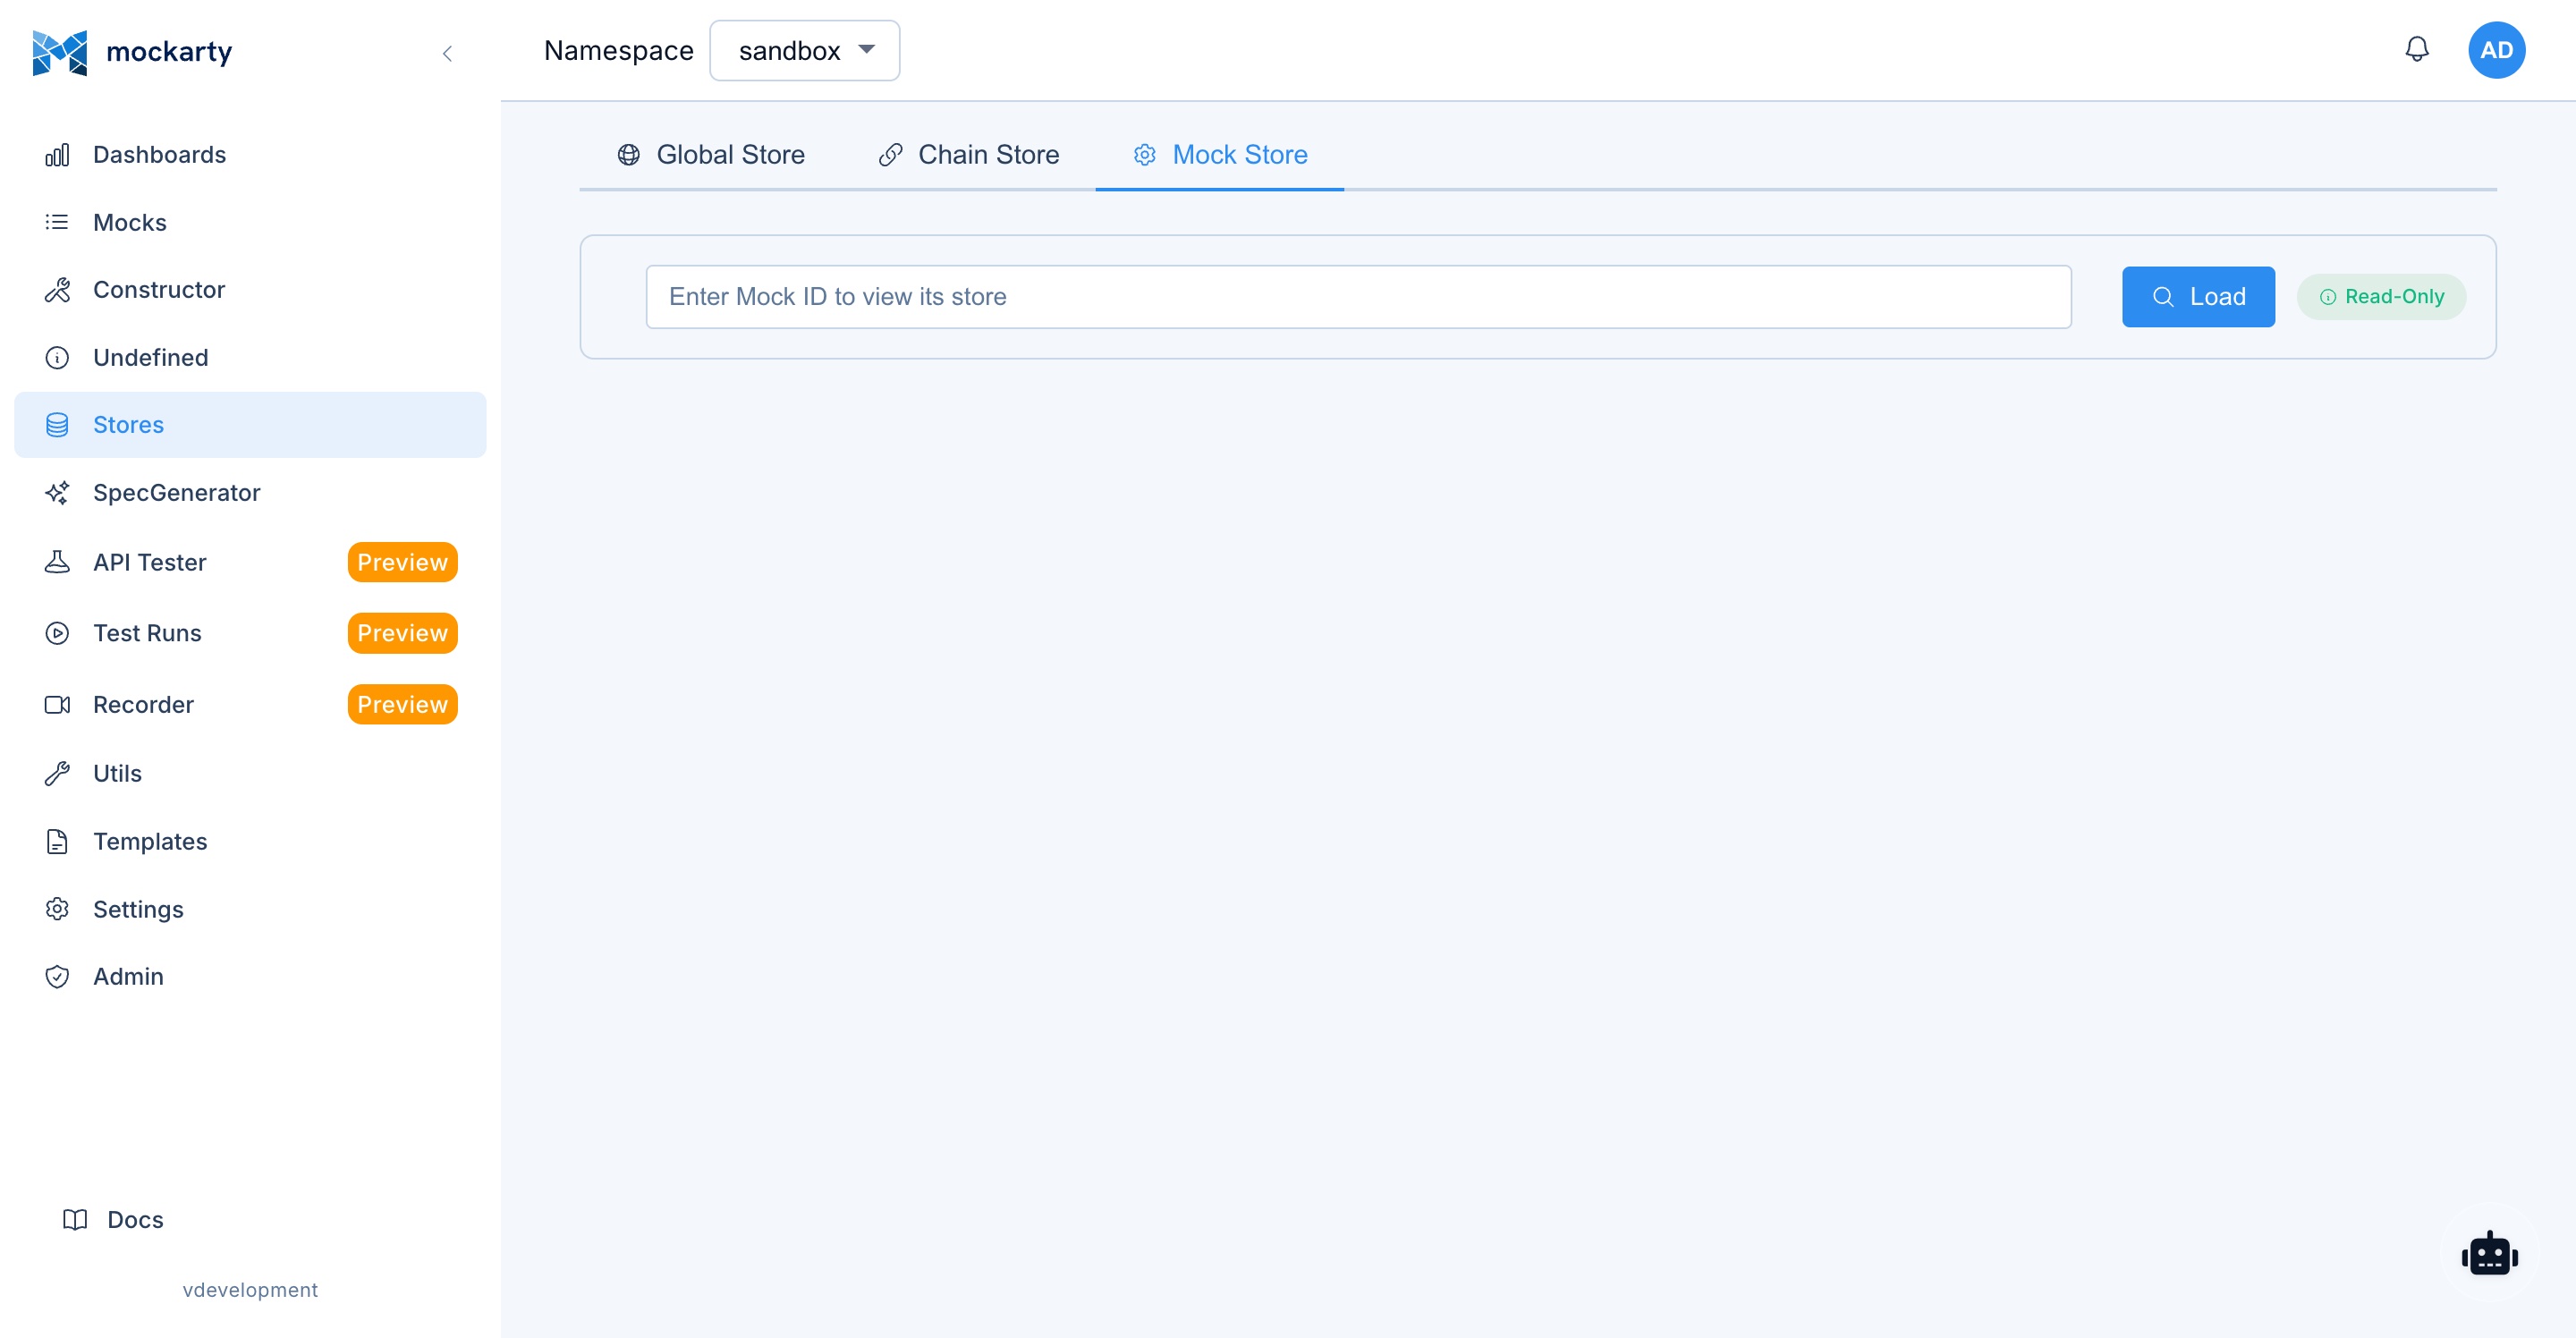
Global Store (gS)
The Global Store provides namespace-scoped persistent key-value storage:
- Scope: Values are shared across all mocks in the namespace.
- Persistence: Values persist until explicitly deleted or the namespace is cleaned up.
- Use cases: Counters (e.g., order sequence numbers), feature flags, shared configuration, cross-mock state.
From the UI, you can:
- View all entries: See all key-value pairs in the Global Store for the current namespace.
- Create entry: Add a new key-value pair manually.
- Edit entry: Modify the value of an existing key.
- Delete entry: Remove a key-value pair.
- Search: Filter entries by key name.
Referencing in mocks: Use $.gS.keyName in response payloads to insert the value of a Global Store key.
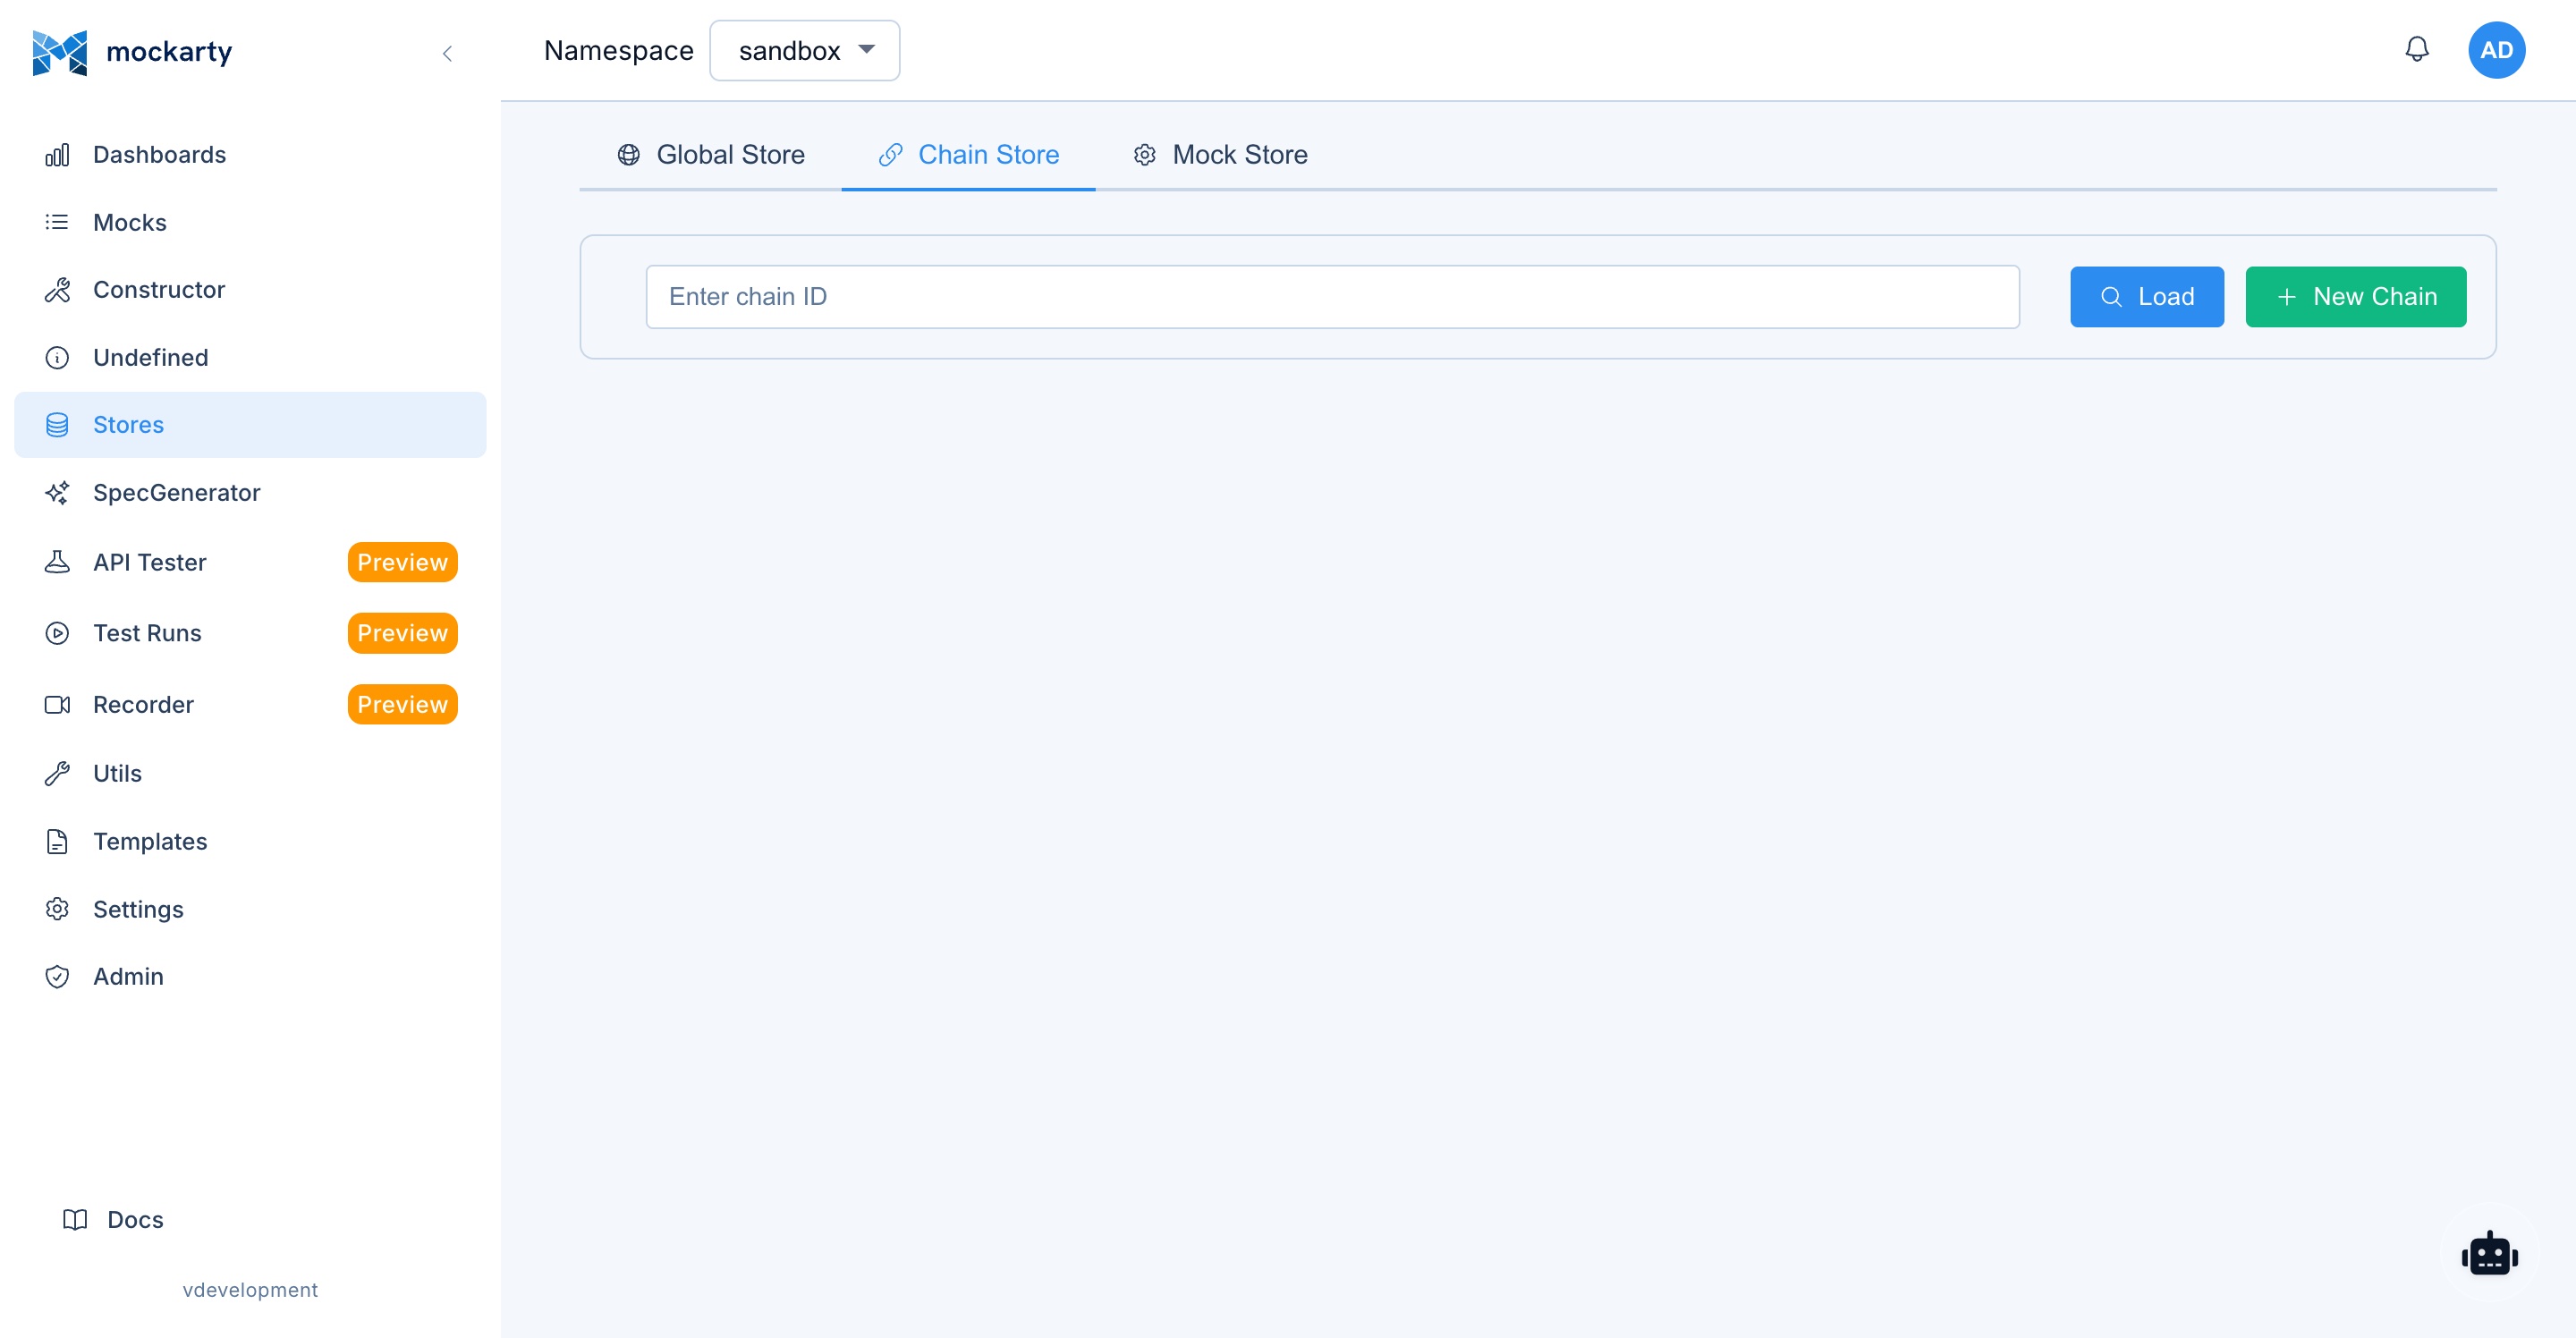
Chain Store (cS)
The Chain Store provides request-chain scoped state for multi-step workflows:
- Scope: Values are shared across mocks that belong to the same chain (linked by a chain ID passed in request headers or body).
- Persistence: Values persist for the duration of the chain.
- Use cases: Multi-step workflows (create order -> get order -> update order -> delete order), session state, conversation context.
The UI shows chain entries grouped by chain ID. You can inspect, edit, and delete individual entries or entire chains.
Referencing in mocks: Use $.cS.keyName in response payloads to insert the value of a Chain Store key for the current chain.
Mock Store (mS)
The Mock Store provides ephemeral per-request state:
- Scope: Values exist only during the processing of a single mock resolution.
- Persistence: Values are discarded after the response is sent.
- Use cases: Intermediate calculations, temporary variables for complex response generation.
The Mock Store is not directly visible in the Stores UI (since values are ephemeral), but it is documented here for completeness.
Referencing in mocks: Use $.mS.keyName in response payloads to insert values set by extractors during the current request processing.
Store Usage in Mock Responses
All three store types can be referenced in mock response payloads using the $.gS.*, $.cS.*, and $.mS.* syntax. For example:
{
  "orderId": "$.gS.lastOrderId",
  "status": "$.cS.orderStatus",
  "processedBy": "$.mS.handlerName",
  "sequenceNumber": "$.increment(gS.orderCounter)"
}
Stores can also be used in conditions to create stateful matching logic.
See also: Store Systems | JsonPath Guide
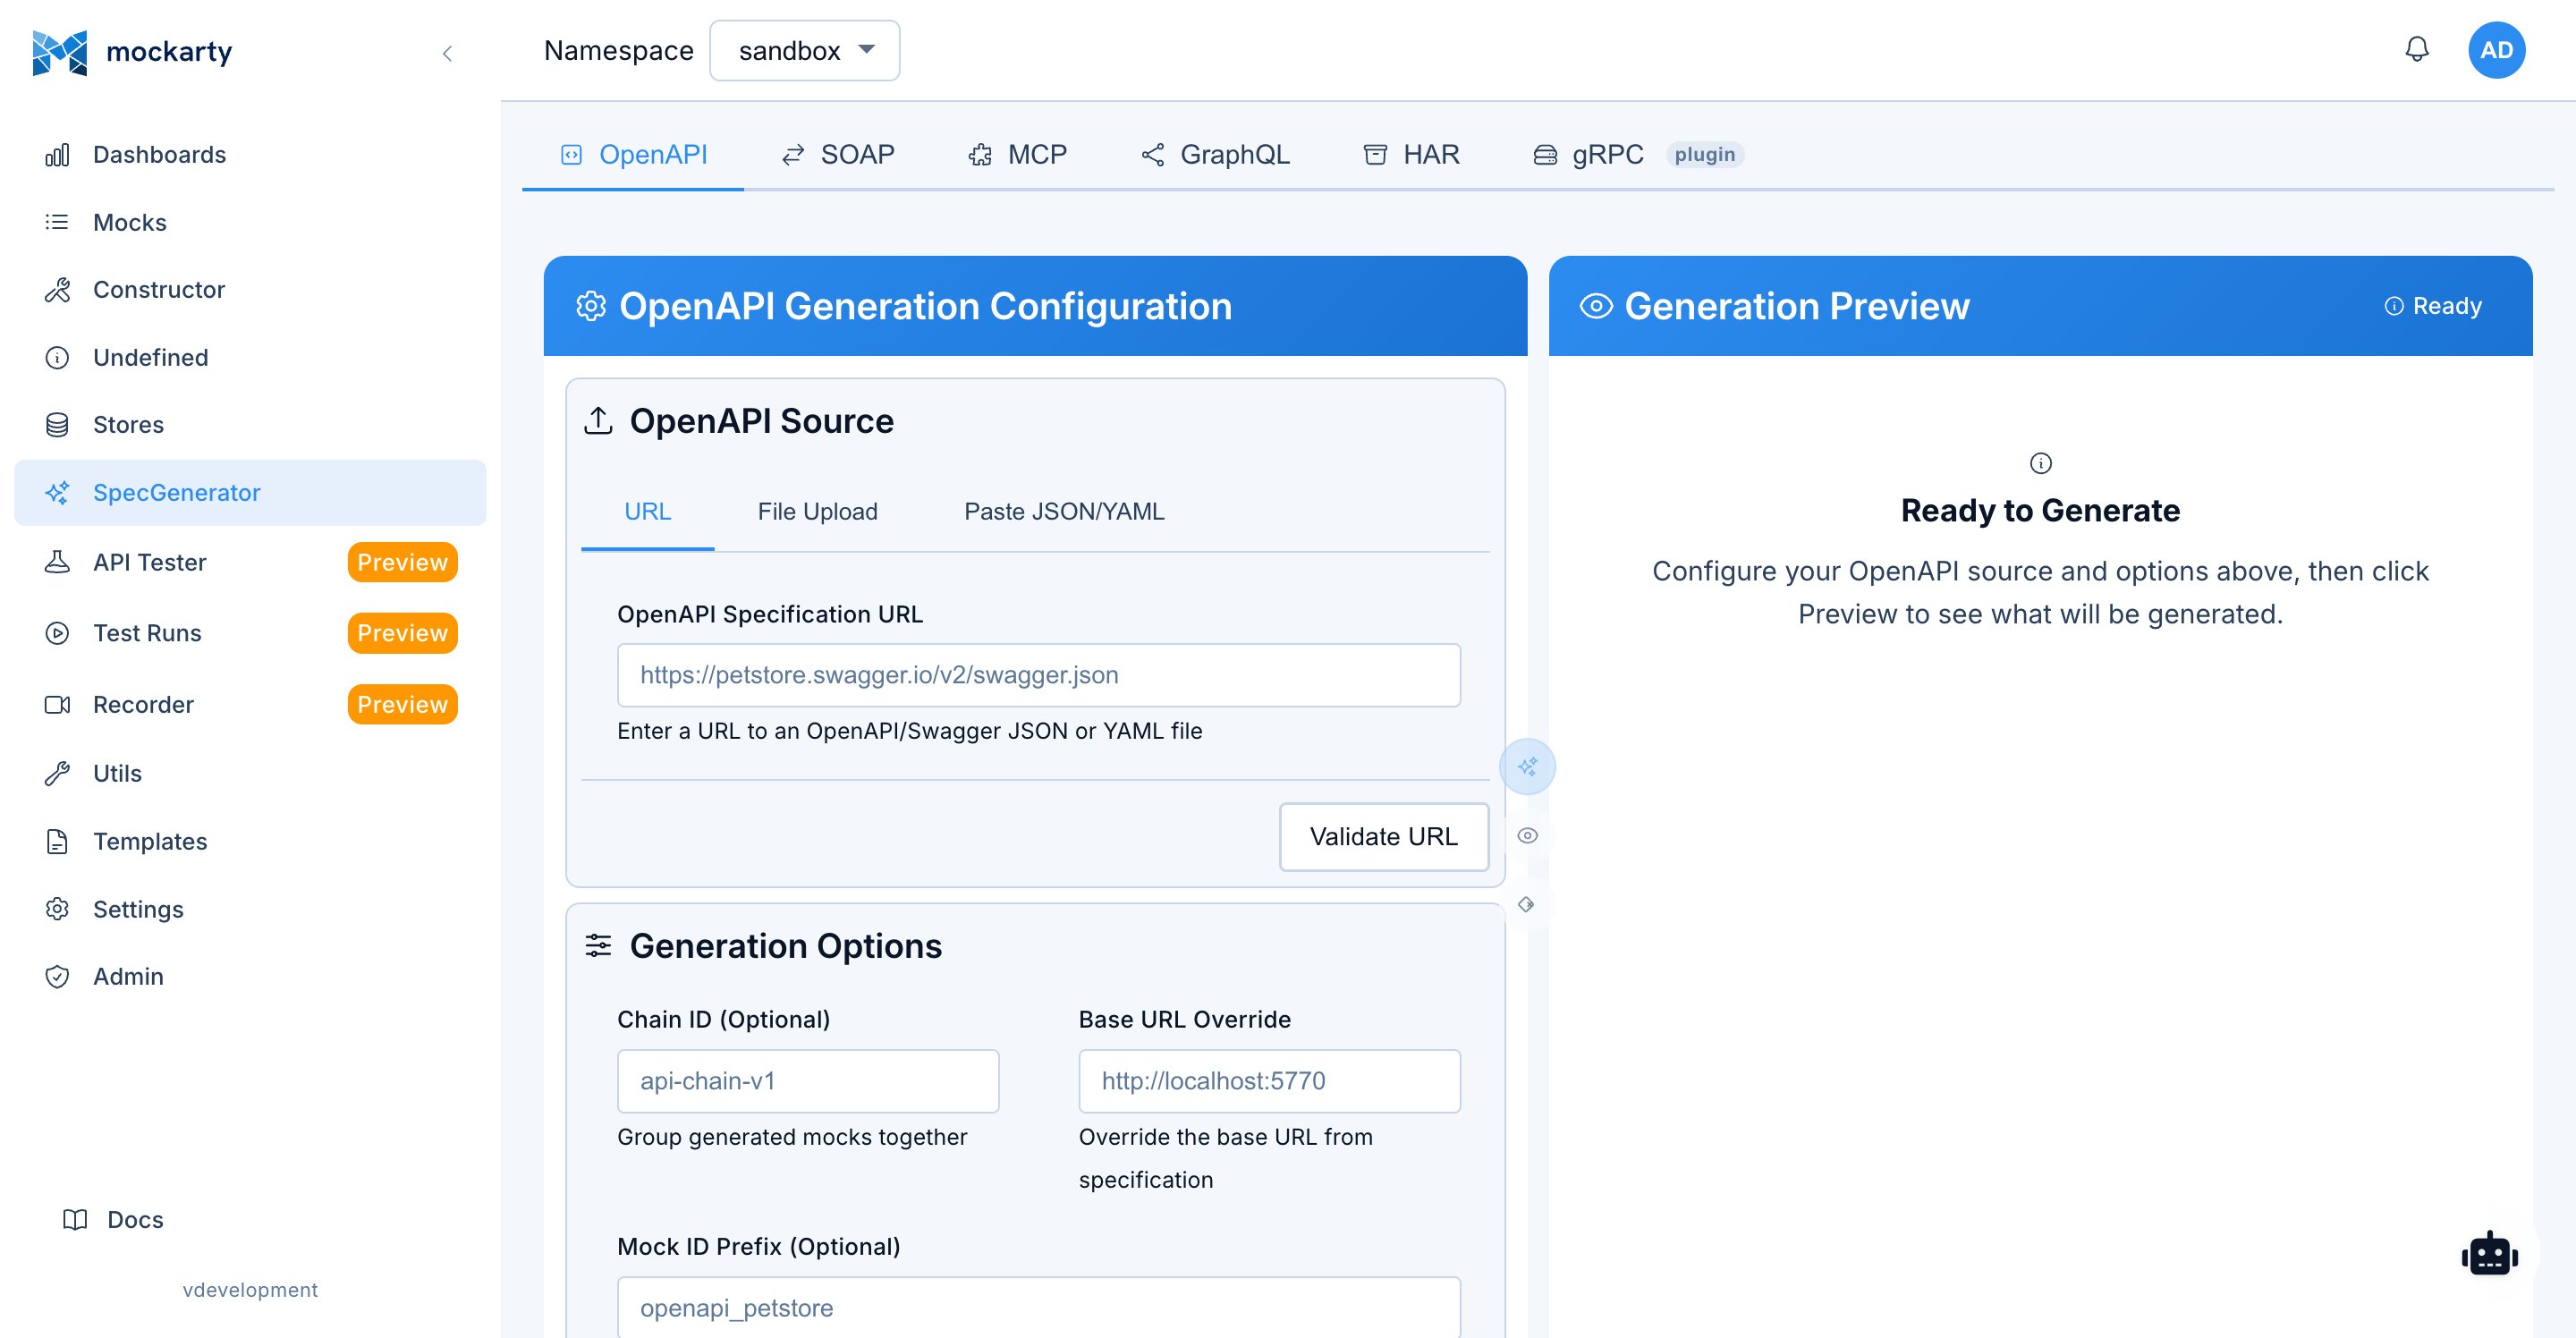
Generator
Path: /ui/generator
The Generator page allows you to bulk-create mocks by importing from various specification formats. Instead of creating mocks one by one in the Constructor, import an existing API specification to generate dozens or hundreds of mocks in seconds.
Import Source Selection
The Generator provides tabbed navigation for different import sources:
OpenAPI / Swagger
Import mocks from OpenAPI 2.0 (Swagger) or OpenAPI 3.0/3.1 specifications:
- File upload: Upload a JSON or YAML specification file from your local machine.
- URL import: Provide a URL to fetch the specification (e.g.,
https://api.example.com/swagger.json). - Features: Automatically generates mocks for all defined endpoints with:
- Route patterns with path parameters.
- HTTP method matching.
- Response payloads based on schema definitions (with Faker values for realistic data).
- Status code mapping from defined responses.
- Request body validation conditions.
WSDL
Import SOAP mocks from WSDL (Web Services Description Language) files:
- Upload a WSDL file or provide a URL.
- Generates mocks for all defined operations.
- Creates XML response templates matching the schema.
- Sets SOAPAction header conditions.
Proto (gRPC)
Import gRPC mocks from Protocol Buffer definition files:
- Upload one or more
.protofiles. - Generates mocks for all defined services and methods.
- Creates JSON response payloads matching message definitions.
- Handles nested messages, enums, and repeated fields.
- Upload proto files as-is —
option go_packageis optional, any format is accepted, and language-specific options are stripped automatically. See the Server Generator documentation for details.
GraphQL
Import GraphQL mocks from schema definitions:
- File upload: Upload a
.graphqlor.gqlschema file. - URL introspection: Provide a GraphQL endpoint URL and Mockarty will run an introspection query to discover the schema.
- Generates mocks for queries and mutations.
- Creates response payloads matching type definitions.
HAR (HTTP Archive)
Import mocks from HAR files captured by browser developer tools or proxy software:
- Upload a
.harfile exported from Chrome DevTools, Firefox, Charles Proxy, Fiddler, or any HAR-compatible tool. - Each recorded request/response pair becomes a mock.
- Preserves original headers, status codes, and response bodies.
- De-duplicates identical requests automatically.
MCP
Import MCP mocks from JSON configuration files:
- Upload a JSON file describing MCP tools, resources, and prompts.
- Generates mocks with input schemas and response templates.
Socket
Import WebSocket or raw socket mocks from configuration files:
- Upload a JSON configuration describing events and message formats.
- Generates event-based mocks with response payloads.
Preview Before Generation
After selecting a source and uploading/providing the specification, the Generator shows a preview of all mocks that will be created:
- HTTP method (or operation type) and route for every mock, with its status code and ID.
- Endpoints grouped by OpenAPI tag/controller (services for gRPC and SOAP, operation types for GraphQL, first path segment when the spec has no tags).
- Compact totals for endpoints and mocks at the top of the panel.
You can:
- Select/deselect individual mocks to include or exclude them from generation.
- Select/deselect a whole group with the group checkbox (partially selected groups show an indeterminate state).
- Collapse/expand groups by clicking the group header.
See also: Server Generator | API Reference
Merge Strategy
When generating mocks that may conflict with existing ones (same route and method), choose a merge strategy:
- Skip existing: Do not create mocks that would conflict with existing ones. Existing mocks remain unchanged.
- Force overwrite: Replace existing mocks with the newly generated ones. The old mocks are soft-deleted.
Namespace and Tag Assignment
Before generating, you can:
- Select namespace: Choose which namespace to create the mocks in (defaults to the current namespace).
- Assign tags: Add one or more tags to all generated mocks for easy identification (e.g., “imported”, “openapi”, “v2.1”).
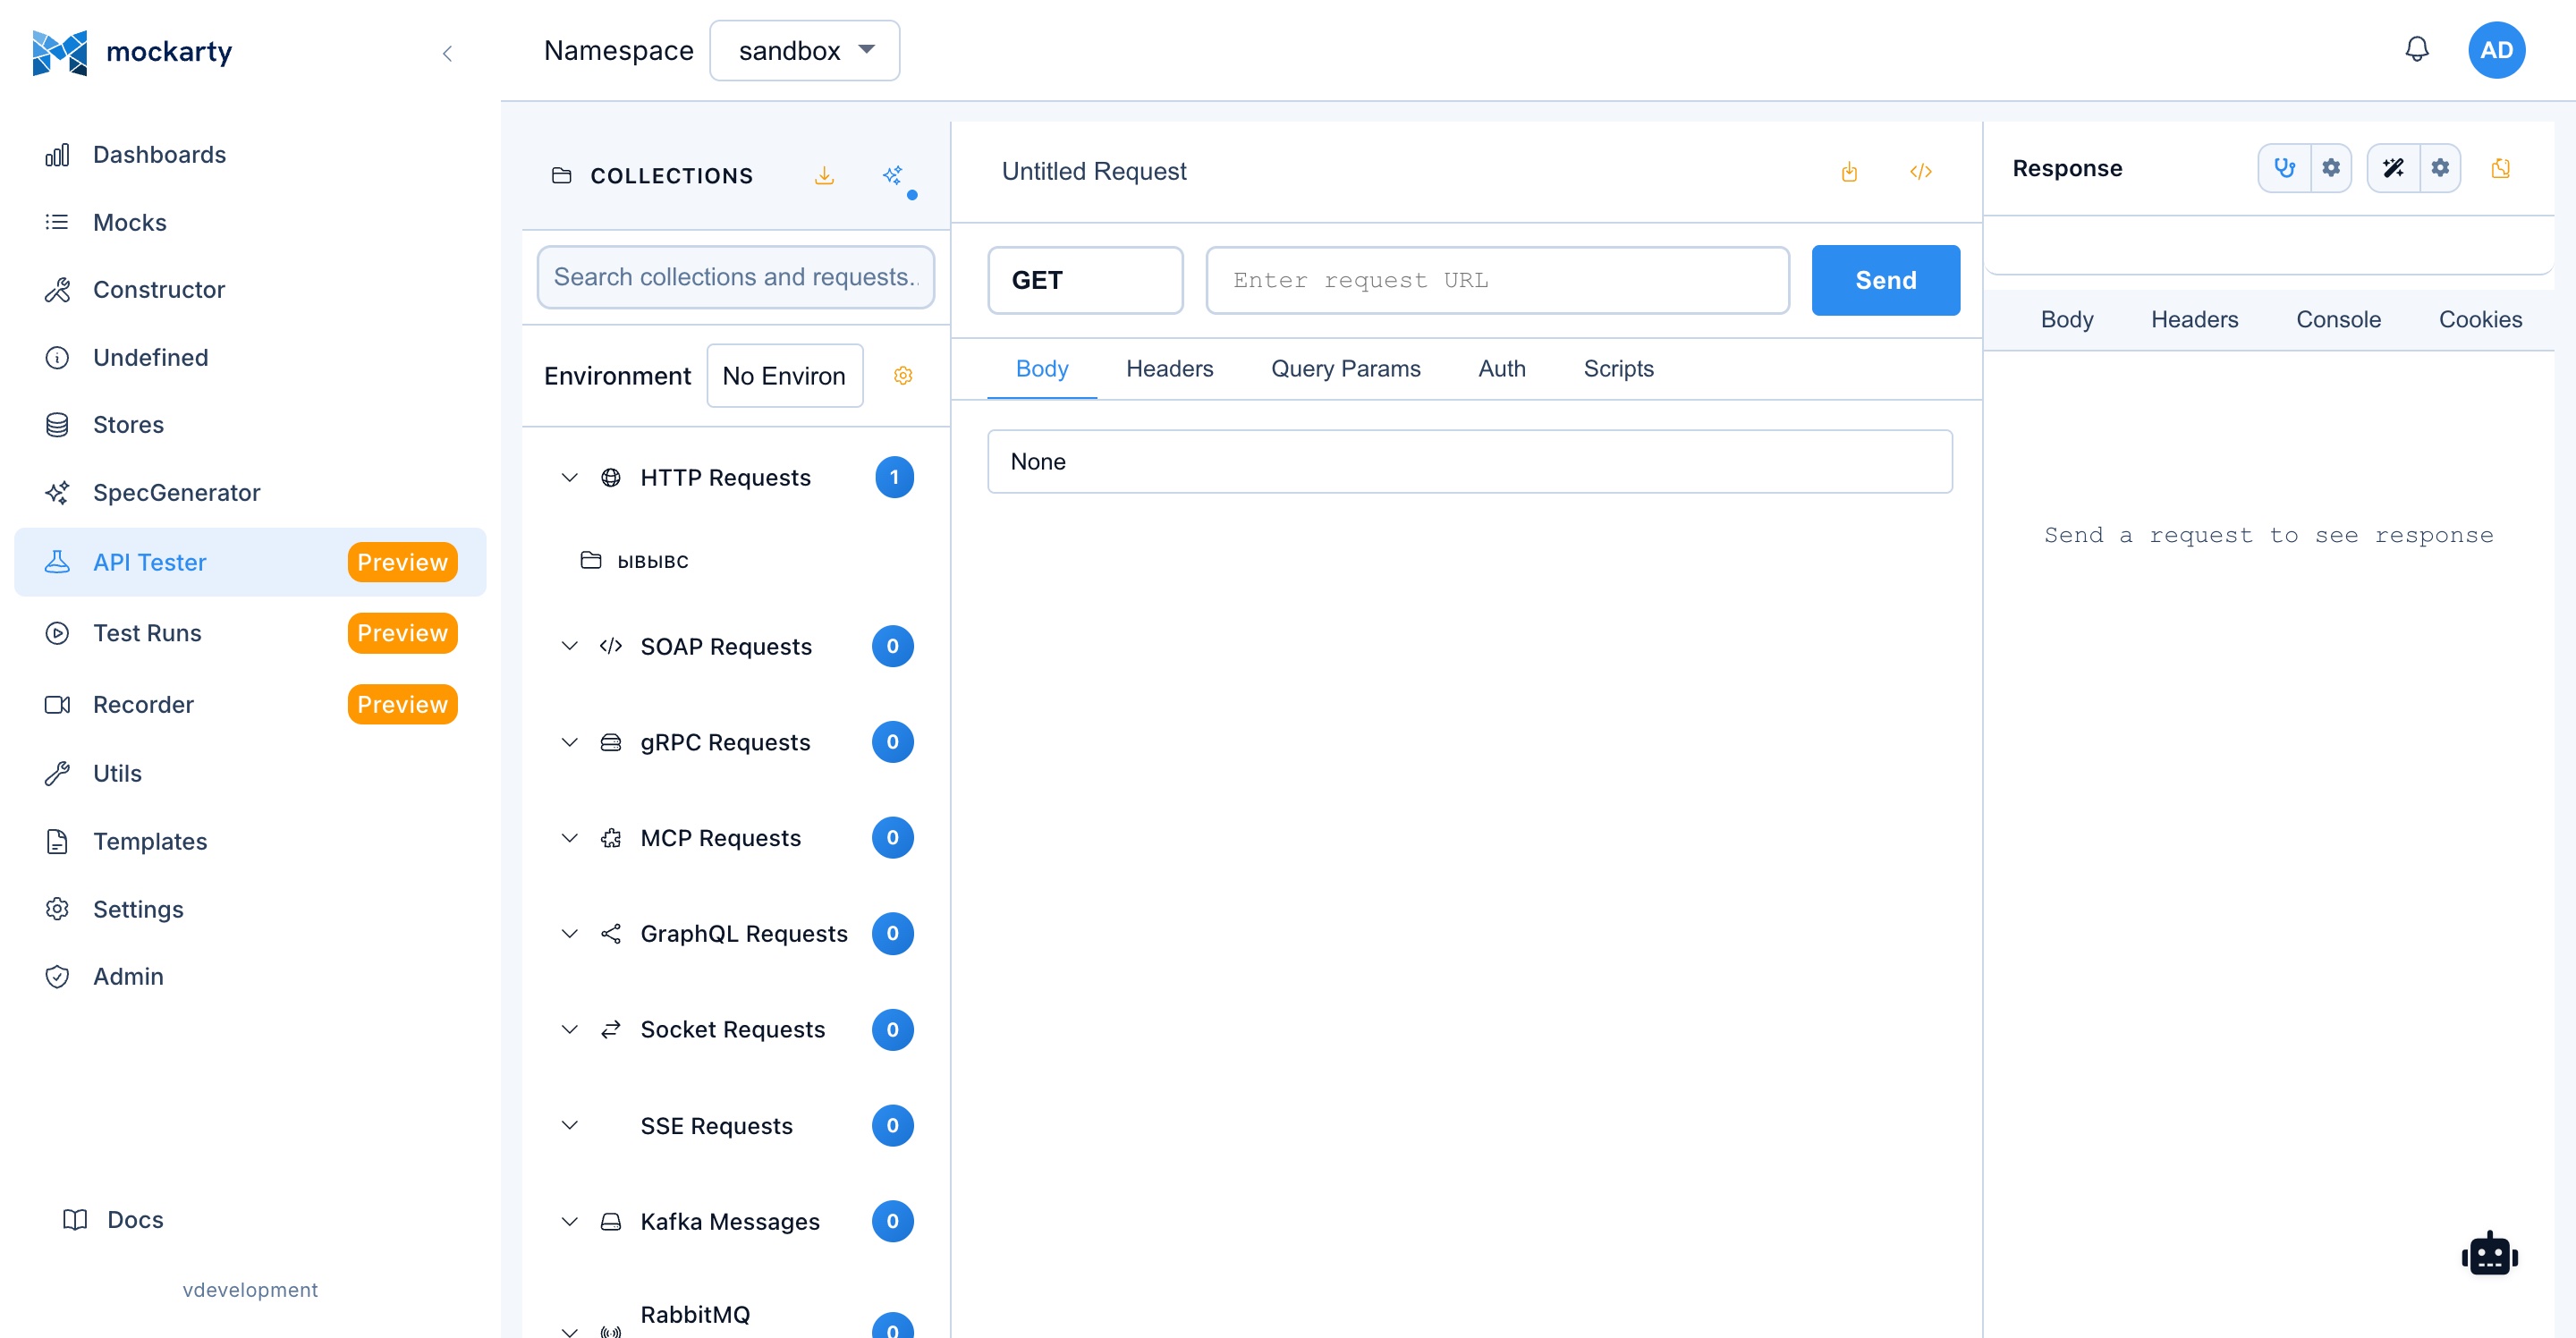
API Tester
Path: /ui/api-tester
The API Tester is Mockarty’s built-in alternative to tools like Postman. You can send requests to any endpoint (your mocks or real services), organize them into collections, write automated test scripts, and switch between environments – all without leaving Mockarty.
AI Feature: Click the AI buttons to generate test scripts, create entire collections from API specs, or generate performance test scripts automatically. See AI Features for details.
Three-Panel Layout
The API Tester uses a three-panel layout:
-
Left panel (Collections sidebar): Hierarchical tree of collections and requests. Create folders within collections to organize requests logically.
-
Center panel (Request editor): Configure and send individual requests. Contains tabs for different request aspects.
-
Right panel (Response viewer): View the response after sending a request, including body, headers, timing, and test results.
Collections
Collections are containers for organizing related requests:
- Create: Click “New Collection” to create a new collection. Give it a descriptive name (e.g., “User Service”, “Payment Flow”).
- Rename: Double-click the collection name to edit it.
- Delete: Right-click and select “Delete”. Collections can be recovered from trash.
- Duplicate: Create a copy of an entire collection with all its requests.
- Share: Share a collection with other users in the same namespace (by exporting or assigning access).
- Folders: Create folders within collections to group related requests (e.g., “Auth”, “CRUD Operations”, “Error Cases”).
Requests
The API Tester supports all protocols that Mockarty can mock:
HTTP Requests
- URL: Enter the full URL or a path (relative to the environment base URL).
- Method: Select the HTTP method (GET, POST, PUT, PATCH, DELETE, HEAD, OPTIONS).
- Headers: Add request headers as key-value pairs. Common headers can be selected from a dropdown.
- Body: Enter the request body in JSON, XML, form-data, or raw text format. A syntax-highlighted code editor is provided.
- Auth: Configure authentication (None, Bearer Token, Basic Auth, API Key, OAuth 2.0).
- Query Params: Add query parameters as key-value pairs. Parameters can include environment variables.
gRPC Requests
- Enter the server address, service name, and method name.
- Provide the request payload as JSON matching the protobuf message definition.
- Add metadata key-value pairs.
- View the response as formatted JSON.
GraphQL Requests
- Enter the GraphQL endpoint URL.
- Write the query or mutation in the GraphQL editor (with syntax highlighting and auto-completion).
- Add variables as JSON.
- View the response with
dataanderrorssections.
SOAP Requests
- Enter the SOAP endpoint URL.
- Write the SOAP envelope in the XML editor.
- Set the SOAPAction header.
- View the XML response.
WebSocket Requests
- Enter the WebSocket URL (
ws://orwss://). - Connect to the server and send/receive messages interactively.
- View the message history with timestamps and direction indicators.
SSE Requests
- Enter the SSE endpoint URL.
- Connect and view incoming events in real time.
- Events are displayed with their type, data, and ID.
Kafka Requests
- Configure broker address and topic.
- Publish messages with key, value, and headers.
- Consume messages from a topic with offset control.
- View consumed messages in a scrollable list.
RabbitMQ Requests
- Configure connection URL, exchange, and routing key.
- Publish messages with headers and properties.
- Consume messages from a queue.
- View consumed messages with metadata.
MCP Requests
- Enter the MCP server URL.
- Select the tool name and provide input parameters.
- View the tool response.
Environment Variables
Environments allow you to define variable sets that can be substituted into requests:
- Create environments: Define environments like “Local”, “Staging”, “Production” with different variable values.
- Variable syntax: Use
{{variableName}}in URLs, headers, body, and query parameters. Variables are replaced with the active environment’s values at send time. - Common variables:
{{baseUrl}},{{apiKey}},{{authToken}},{{userId}}. - Secret variables: Values whose key looks like a secret (
token,password,api_key, …) are masked in the editor; use the eye button to reveal them. - Secret store references: A value can reference the namespace secret store:
{{secret:storeName/keyName}}. The reference is resolved on the server at send time and the plaintext never appears in the UI. Secret references work only with server-side execution — client-side (browser) execution rejects them with a clear error. - Active environment: Select the active environment from a dropdown in the top bar of the API Tester. Only one environment is active at a time (per user).
- Shared environments: Tick Share with namespace in the environment editor to make an environment visible to every member of the namespace. Teammates can view and activate a shared environment, but only the owner can edit, delete, or unshare it. Each user’s active-environment choice is independent — activating a shared environment never changes anyone else’s selection.
Pre-Request Scripts
Pre-request scripts execute before a request is sent, allowing you to:
- Dynamically set headers, query parameters, or body values.
- Generate authentication tokens or signatures.
- Set environment or collection variables programmatically.
- Chain requests by using data from previous responses.
Scripts use a JavaScript-like syntax with a built-in API for accessing request properties and environment variables.
Test Scripts
Test scripts execute after a response is received, allowing you to write assertions:
- Status code assertions: Verify the response status code.
- Body assertions: Check specific fields in the response body using JsonPath.
- Header assertions: Verify response headers.
- Timing assertions: Assert that the response time is within acceptable bounds.
- Variable extraction: Save response values to environment or collection variables for use in subsequent requests.
Test results are displayed in the response panel with pass/fail indicators and error details.
Request History
The API Tester maintains a history of all sent requests:
- View previous requests with their responses.
- Re-send a historical request with one click.
- Compare responses across multiple executions.
- History is scoped to the current user and namespace.
Import
The API Tester supports importing from multiple formats:
- Postman: Import Postman collections (v2.0 and v2.1 JSON format) with requests, folders, environments, and pre-request/test scripts.
- SoapUI: Import SoapUI projects with SOAP and REST requests.
- OpenAPI: Import an OpenAPI specification to generate a collection with one request per endpoint.
- WSDL: Import a WSDL file to generate SOAP requests.
- gRPC: Import
.protofiles to generate gRPC requests. - GraphQL: Import a GraphQL schema or introspect an endpoint.
- MCP: Import an MCP configuration file.
- HAR: Import a HAR file to recreate captured requests.
- JMeter: Import an Apache JMeter test plan (
.jmx). Every HTTP sampler becomes an editable request; JSON/Regex/Boundary extractors and Response/Duration assertions become the request’s test script;${var}references become{{var}}environment variables; User Defined Variables can be imported as a new environment; thread groups map to separate collections. Constructs that can’t be mapped (CSV Data Set, Cookie Manager,${__function}calls) are listed as import notes. - Mockarty format: Import collections exported from another Mockarty instance.
Export Collections
Export collections in Mockarty’s native JSON format for backup, sharing, or migration between environments.
Generate Mocks from Responses
After receiving a response in the API Tester, click “Create Mock” to generate a mock based on:
- The request’s route, method, and headers.
- The received response’s status code, headers, and body.
- Detected path parameters and query parameters.
This is useful when recording real API behavior and converting it to mocks.
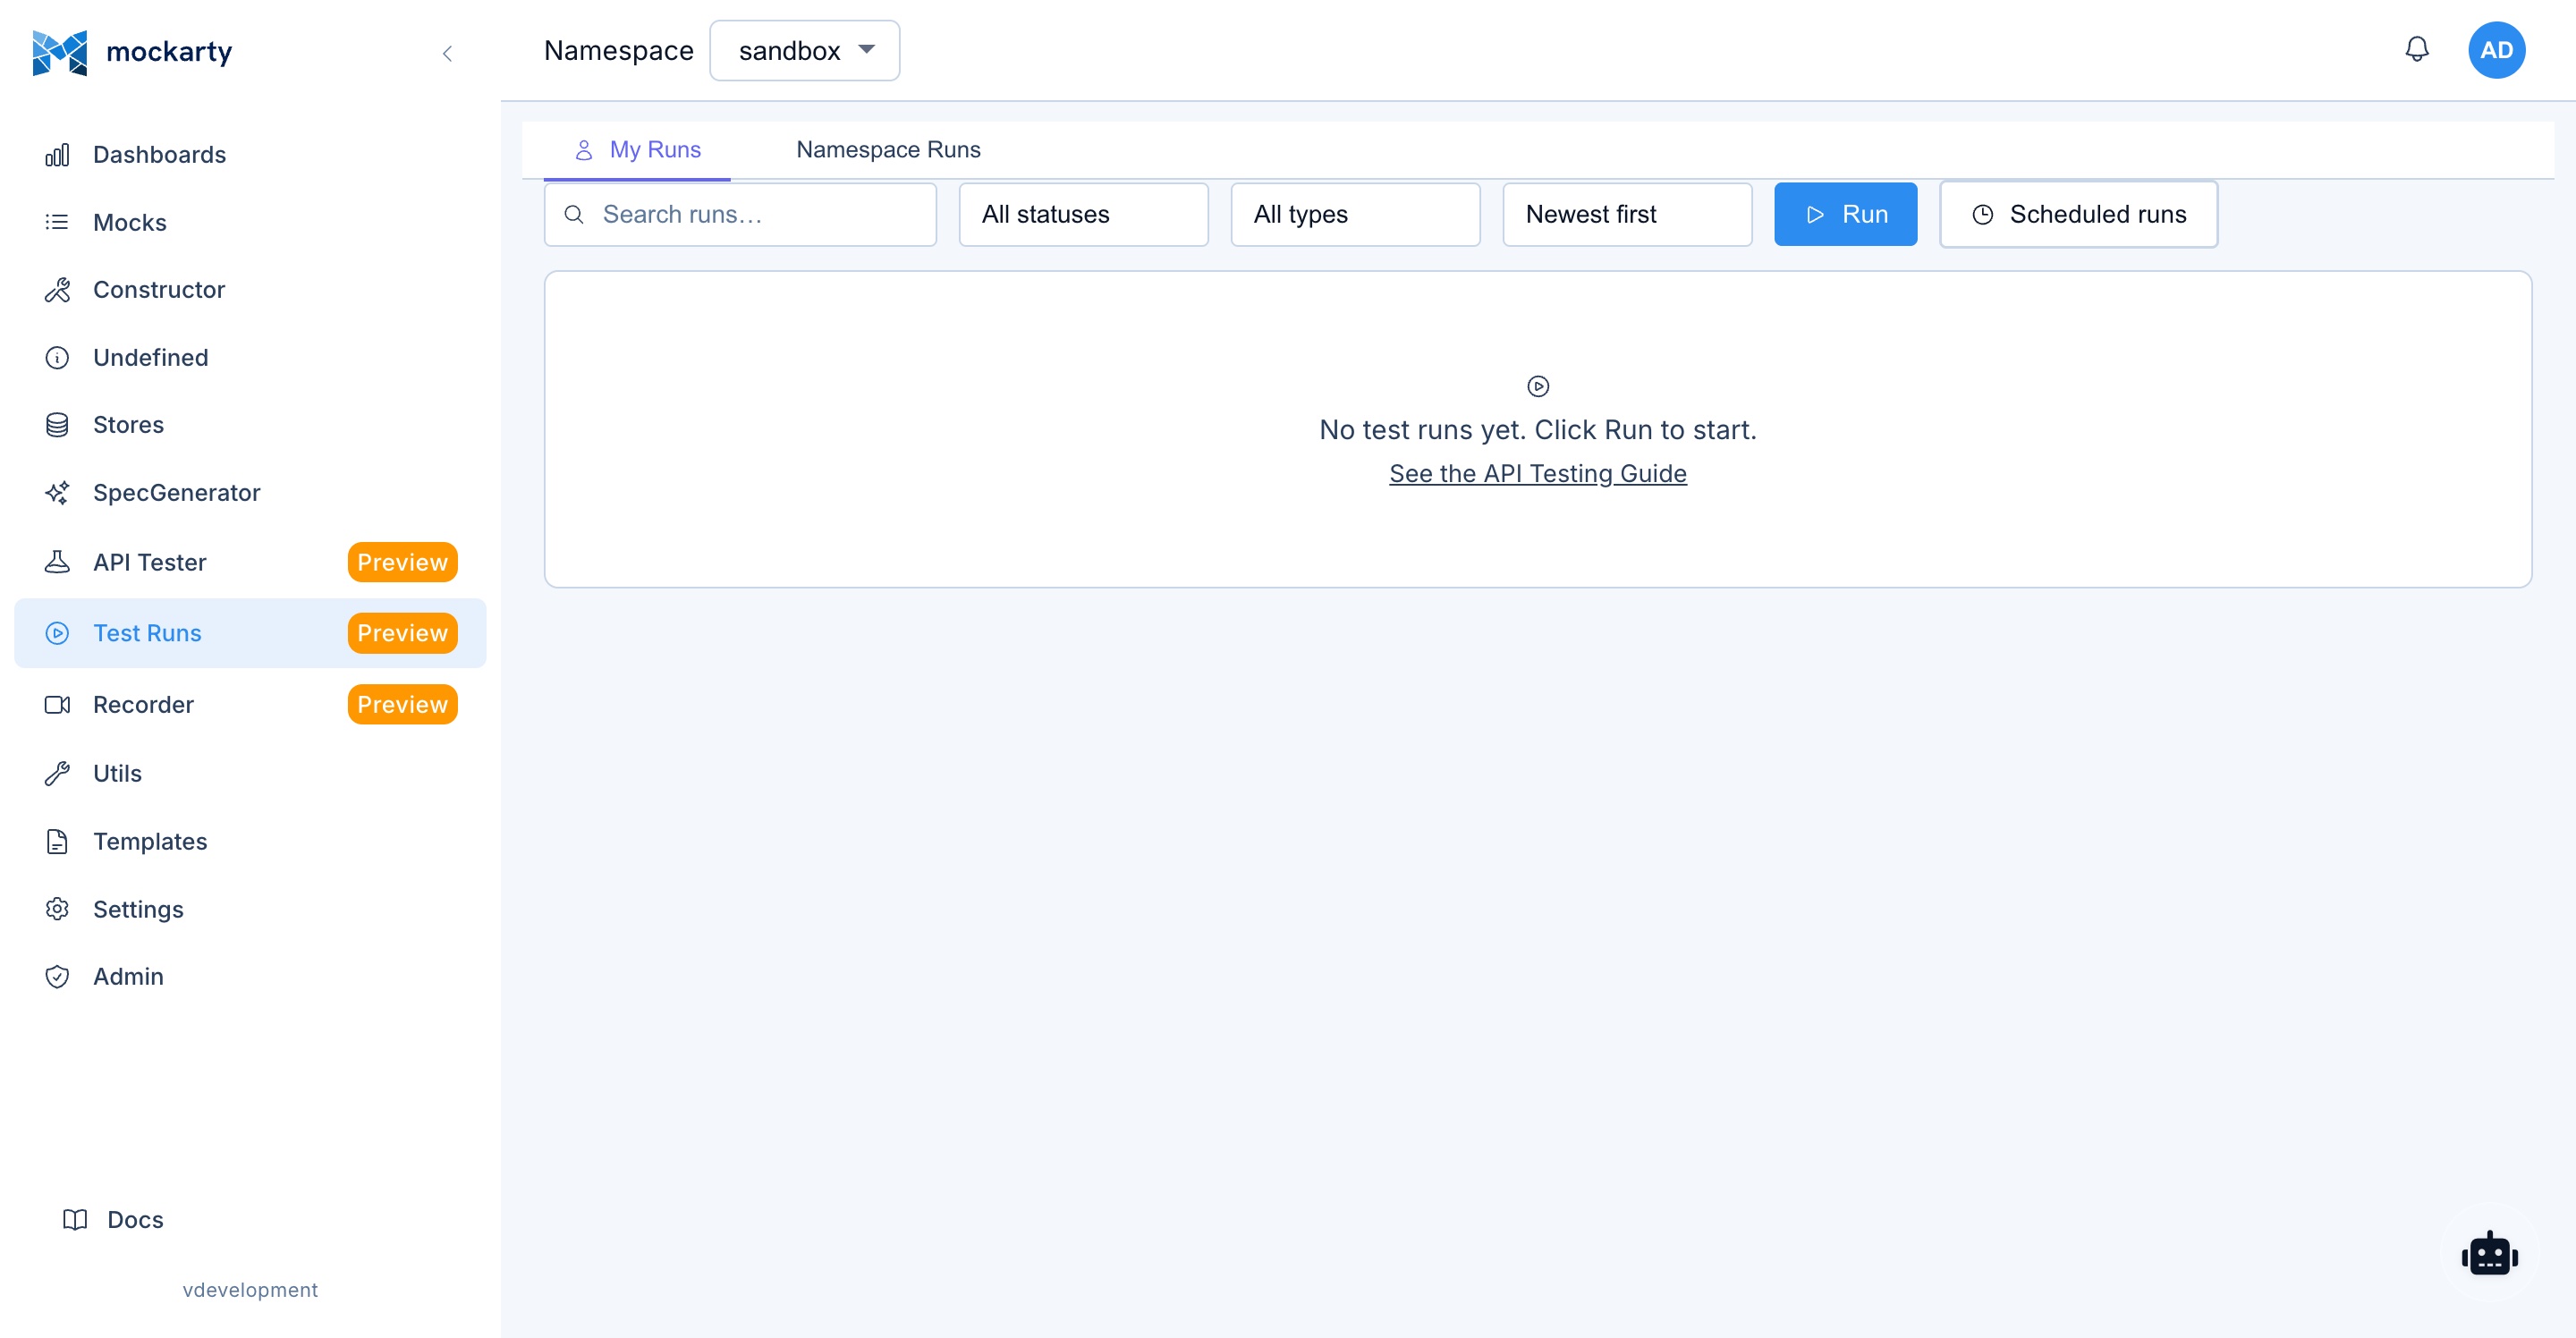
Test Runs
Path: /ui/test-runs
The Test Runs page shows the results of all test executions, including collection runs, scheduled test runs, and performance tests.

AI Feature: Click the Analyze Report button on any test run to get AI-powered diagnostics of failures and performance issues. See AI Features for details.
Test Execution List
The main view displays all test runs in a table:
- Run ID: Unique identifier for the test run.
- Collection: The collection that was tested.
- Type: Collection run, scheduled run, or performance test.
- Status: Running, completed, failed, or cancelled.
- Started / Finished: Timestamps for the test run.
- Duration: Total execution time.
- Pass / Fail: Number of passed and failed assertions.
- Triggered by: The user or schedule that initiated the run.
Filter test runs by status, type, collection, or date range.
Test Report Detail
Click on any test run to see the detailed report:
- Summary: Overall pass/fail count, execution time, and status.
- Request-by-request results: Each request in the collection with:
- Request details (method, URL, body).
- Response details (status code, body, headers).
- Assertion results (passed/failed with expected vs. actual values).
- Execution time.
- Error details: For failed assertions, detailed error messages explaining what went wrong.
- Timeline view: Visual timeline showing request execution order and timing.
APDEX Scoring
For performance test runs (see Performance Testing), the report includes an APDEX (Application Performance Index) score:
- Score: A value between 0 and 1, where 1 is perfect satisfaction.
- Rating: Excellent (> 0.94), Good (> 0.85), Fair (> 0.70), Poor (> 0.50), Unacceptable (<= 0.50).
- Breakdown: Counts of satisfied, tolerating, and frustrated responses based on the configured threshold.
- Threshold (T): The target response time in milliseconds. Responses under T are “satisfied”, under 4T are “tolerating”, and above 4T are “frustrated”.
Latency Statistics
Performance test reports include detailed latency statistics:
- Mean: Average response time across all requests.
- Median (p50): The 50th percentile response time.
- p95: 95th percentile (95% of requests were faster than this).
- p99: 99th percentile (99% of requests were faster than this).
- Min / Max: Fastest and slowest response times.
- Standard Deviation (StdDev): Measure of response time variability.
- Coefficient of Variation (CV): StdDev as a percentage of the mean, indicating consistency.
Export Reports
Export test reports in JSON format:
- JSON: Machine-readable format for CI/CD integration and sharing with stakeholders.
Cancel Running Tests
For long-running tests, click the “Cancel” button to stop execution. Partial results are preserved and can be viewed in the report.
Test Cases
Path: /ui/test-cases
The Test Cases page is Mockarty’s built-in Test Management System (TMS). It lets you organise manual and automated test cases into a folder hierarchy, track their execution, and integrate with your team’s workflow.
Key capabilities
- Folder tree (up to 8 levels deep) — mirror your project or module structure. Drag to reorder, right-click for a context menu. Multi-select with Ctrl+Click for bulk operations.
- Case builder — write steps with Action + Expected Result, attach files, set dependencies between steps, pick execution mode (auto / manual / semi-automatic).
- Shared steps — reusable step fragments you can embed by reference across multiple cases. Changes propagate automatically.
- Version history — every save creates a versioned snapshot. Compare any two versions and roll back to any previous state.
- Review workflow — submit a case for review, leave comments, approve or reject. The review panel shows history and who acted.
- External tracker links — link cases to Jira, GitHub, Linear, or GitLab issues. Linked issue titles and statuses appear as live chips.
Running test cases
Test cases can be executed:
- One-off — from the builder via the Run button.
- As part of a Test Plan — add the
test_caseitem type to a plan. - Batched (synthetic plan) — select multiple cases and trigger a batch run.
Results feed into the same unified Test Run report as every other test type.
Full reference: Test Case Management · Test Case Steps · Runtime Flow View · Attachments
Test Plans
Path: /ui/test-plans
Test Plans orchestrate any combination of test types — functional (API Tester), load (k6), fuzz, chaos, and contract — into a single, repeatable workflow. Each plan gets a stable numeric ID (#42) so CI/CD pipelines can reference it by name or number.
What a plan contains
- Items — the individual test steps. Each item points to a resource (an API Tester collection, a load-test config, a fuzz config, etc.) and has an order and optional dependencies.
- Execution mode —
fifo(sequential, default),parallel(all items at once), ordag(respectsdependsOnand Gates). - Gates — conditions that block the next item if the previous one fails (e.g., stop the load test if the smoke test failed).
- Schedules — attach one or more cron / one-shot / interval schedules to run the plan automatically.
- Override surfaces — per-run variable overrides and item subsets for targeted reruns.
Running a plan
Click Run in the plan detail view, or trigger via CLI (mockarty-cli testplan run) or API (POST /api/v1/test-plans/:id/run). The Run View shows live progress with per-item status and a unified log stream. The final report consolidates all item results into a single Allure-compatible export.
Full reference: Test Plans · Advanced Test Plans · Test Plans in CI/CD · Run View · Plan Report
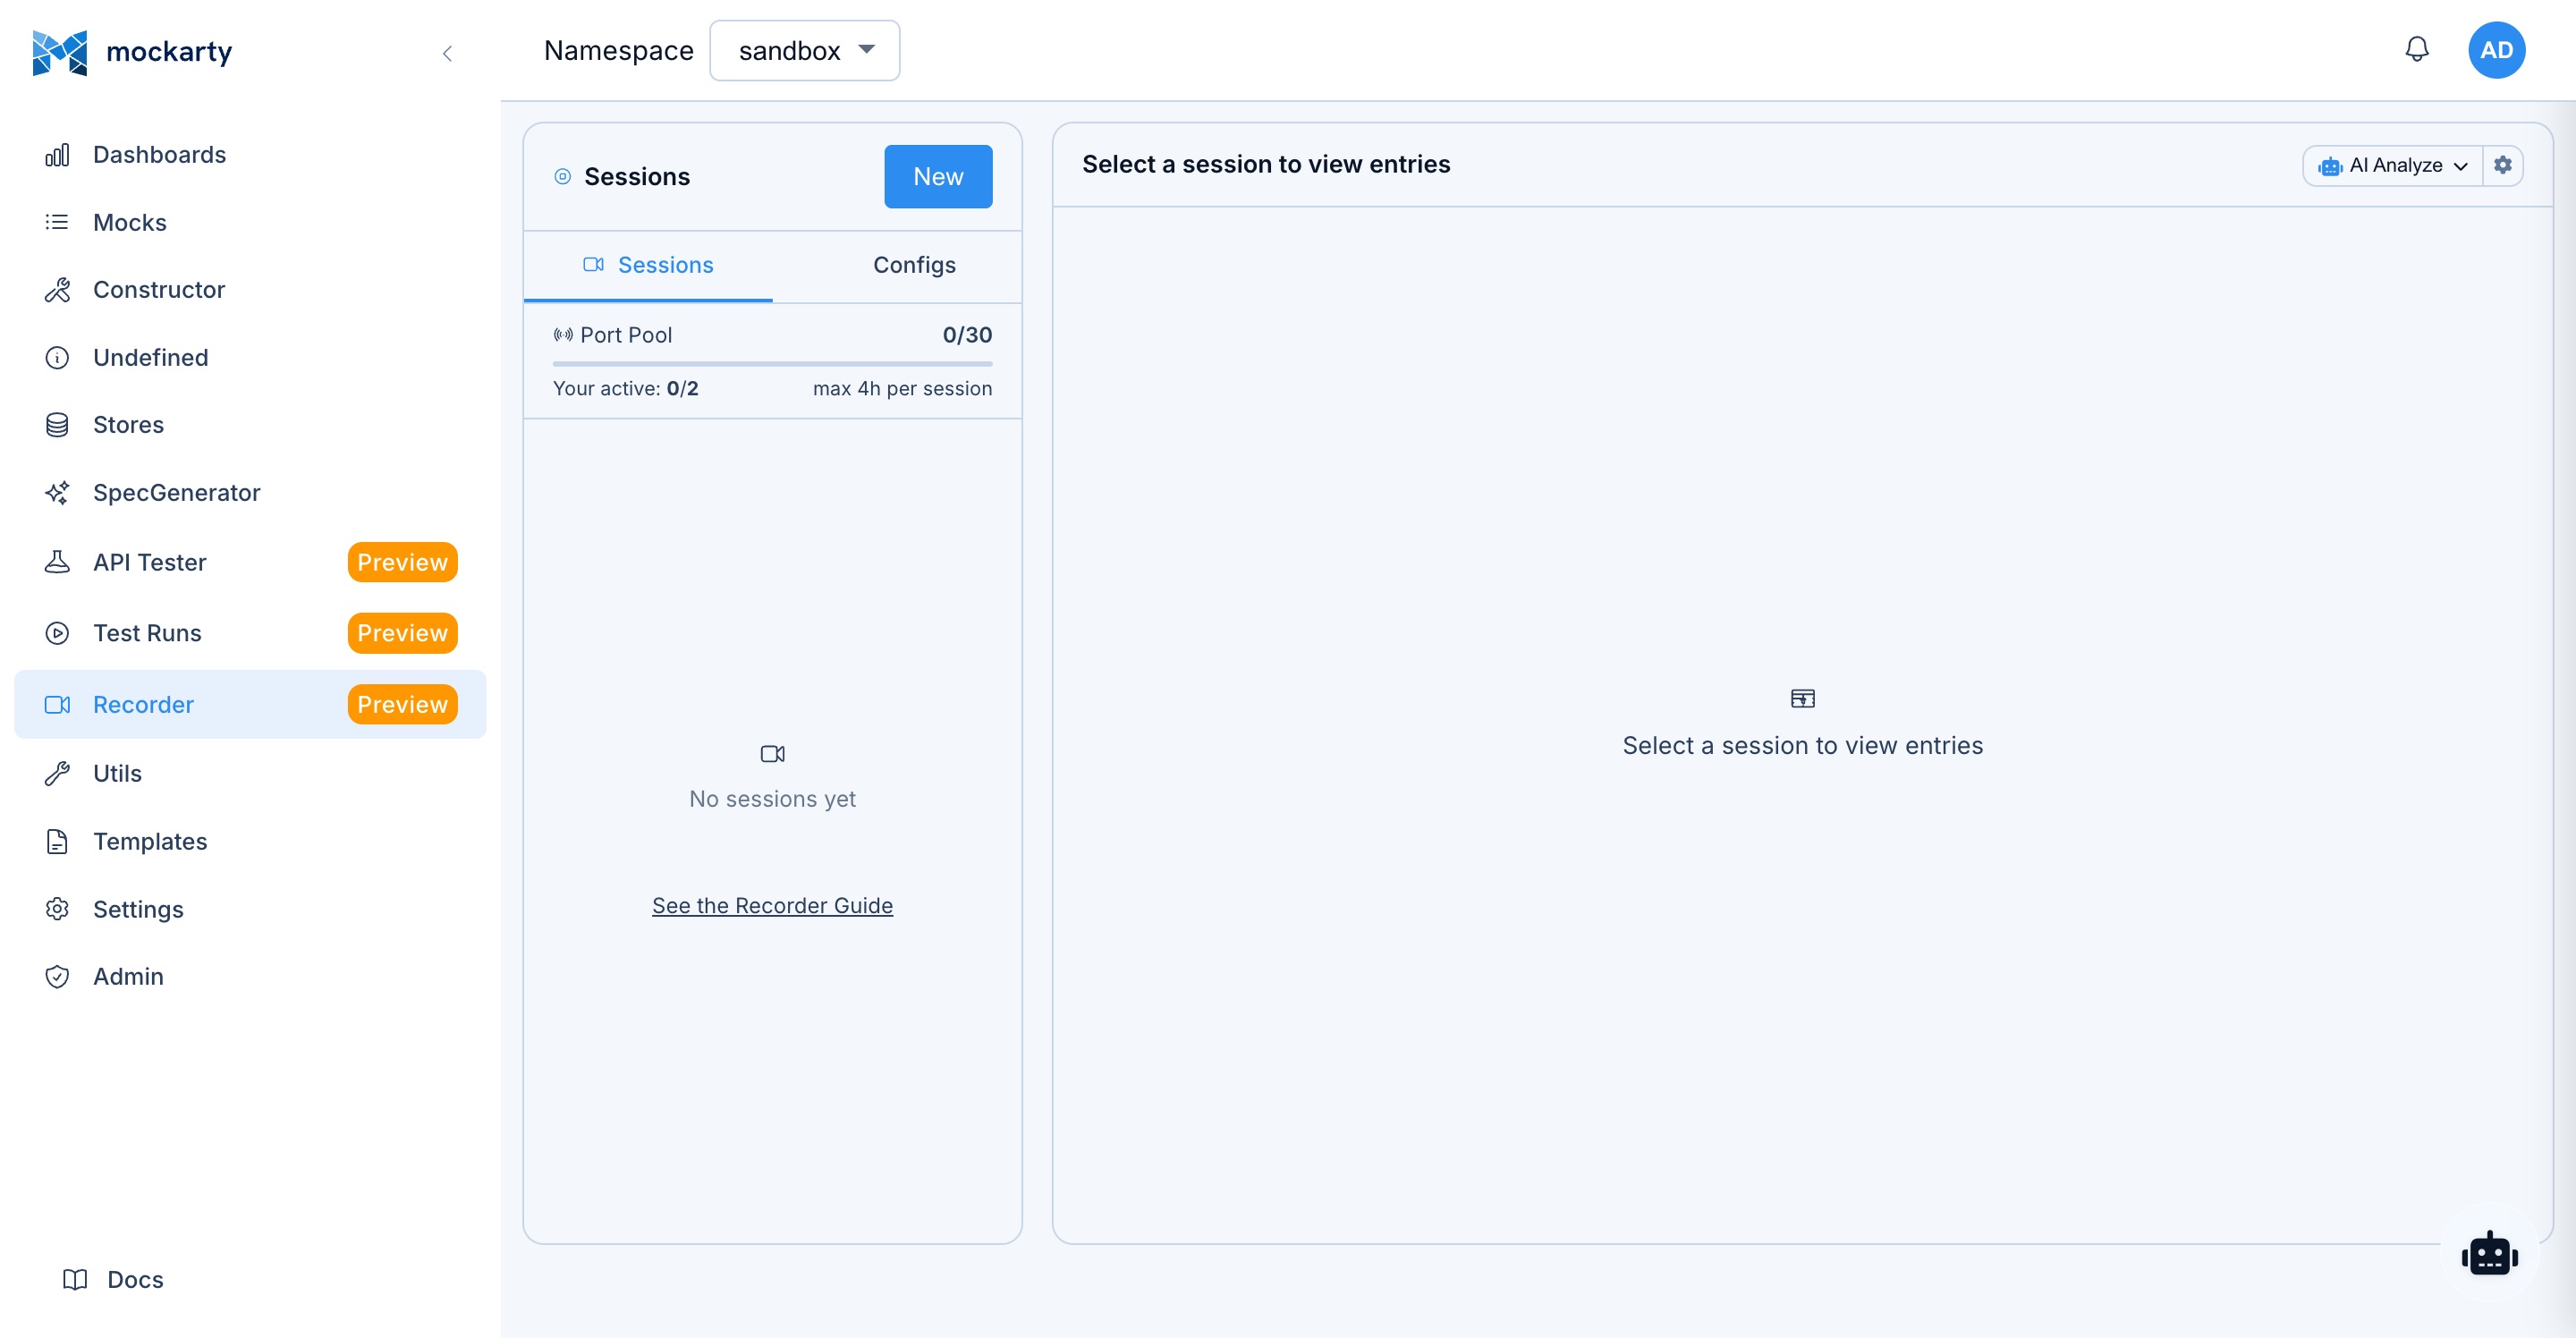
Recorder
Path: /ui/recorder
The Recorder lets you capture real network traffic between your application and its backend services. Once captured, you can inspect every request and response, replay them, or convert them directly into mocks with a single click. It is the fastest way to create mocks that accurately reflect how a real service behaves.


AI Feature: Click the Analyze Traffic button on recorded sessions for AI-powered traffic analysis, security audit, or scenario discovery. See AI Features for details.
Session Management
Recording is organized into sessions:
- Start: Click “Start Recording” to begin a new session. Configure the recording mode and port.
- Stop: Click “Stop” to end the current recording session. Captured entries are preserved.
- Restart: Stop and immediately start a new session with the same configuration.
- Delete: Remove a session and all its captured entries.
Multiple sessions can exist simultaneously, but only one session per port can be actively recording.
Recording Modes
Reverse Proxy Mode
Mockarty acts as a reverse proxy in front of a target service:
- Configure the target URL (the real backend service).
- All requests sent to the recorder’s port are forwarded to the target.
- Both the request and response are captured.
- The target’s response is returned to the client unmodified (unless header modification rules are configured).
Forward Proxy Mode
Mockarty acts as an HTTP(S) forward proxy:
- Configure your client (browser, application, or test suite) to use Mockarty as its HTTP proxy.
- All HTTP traffic is captured as it passes through.
- For HTTPS traffic, Mockarty performs MITM (Man-in-the-Middle) interception using a generated certificate.
Captured Traffic Types
The Recorder captures:
- HTTP requests/responses: Method, URL, headers, body, status code, timing.
- WebSocket messages: Connection upgrade, individual messages (both directions), connection close.
- SSE events: Event type, data, ID, and retry values.
Entry List
Captured entries are displayed in a list with:
- Timestamp: When the entry was captured.
- Method: HTTP method or protocol indicator.
- URL: The full request URL.
- Status: Response status code (color-coded: green for 2xx, yellow for 3xx, red for 4xx/5xx).
- Duration: Response time in milliseconds.
- Size: Response body size.
Entries can be filtered by method, status code range, URL pattern, and content type.
Entry Detail
Click on any entry to see the full details:
- Request tab: Method, URL, headers (formatted table), query parameters, and body (syntax-highlighted).
- Response tab: Status code, headers, and body (syntax-highlighted for JSON/XML/HTML).
- Timing tab: DNS lookup, TCP connection, TLS handshake, time to first byte, and total duration.
Header/Metadata Modification Rules
Configure rules to modify headers as traffic passes through the recorder:
- Add header: Inject a new header into requests or responses.
- Remove header: Strip a header from requests or responses.
- Replace header: Change a header’s value using string replacement or regex.
Rules are applied in order and can target requests, responses, or both.
MITM Certificate Management
For HTTPS recording in forward proxy mode:
- Generate CA certificate: Mockarty generates a root CA certificate for MITM interception.
- Download CA certificate: Download the certificate to install in your browser or system trust store.
- Certificate status: View the current certificate’s validity period and fingerprint.
Port Pool Configuration
Configure the range of ports available for recorder sessions. Each session requires a dedicated port for proxying traffic.
Export Options
Captured traffic can be exported in multiple formats:
- HAR file: Standard HTTP Archive format compatible with browser dev tools, Charles Proxy, and other tools.
- Performance test script: Generate a performance test script from captured traffic for load testing.
- Test script with assertions: Generate API Tester test scripts with assertions based on the captured responses.
- API Tester collection: Create an API Tester collection with one request per captured entry.
Create Mocks from Entries
Select one or more captured entries and click “Create Mocks” to generate mocks based on:
- The captured request’s route, method, and headers.
- The captured response’s status code, headers, and body.
- Automatically detected path parameters.
This is the fastest way to create realistic mocks based on actual service behavior.
See also: Traffic Recorder
Live Updates
During an active recording session, new entries appear in the list in real time via WebSocket updates. No page refresh is needed. A live indicator shows the recording status and entry count.
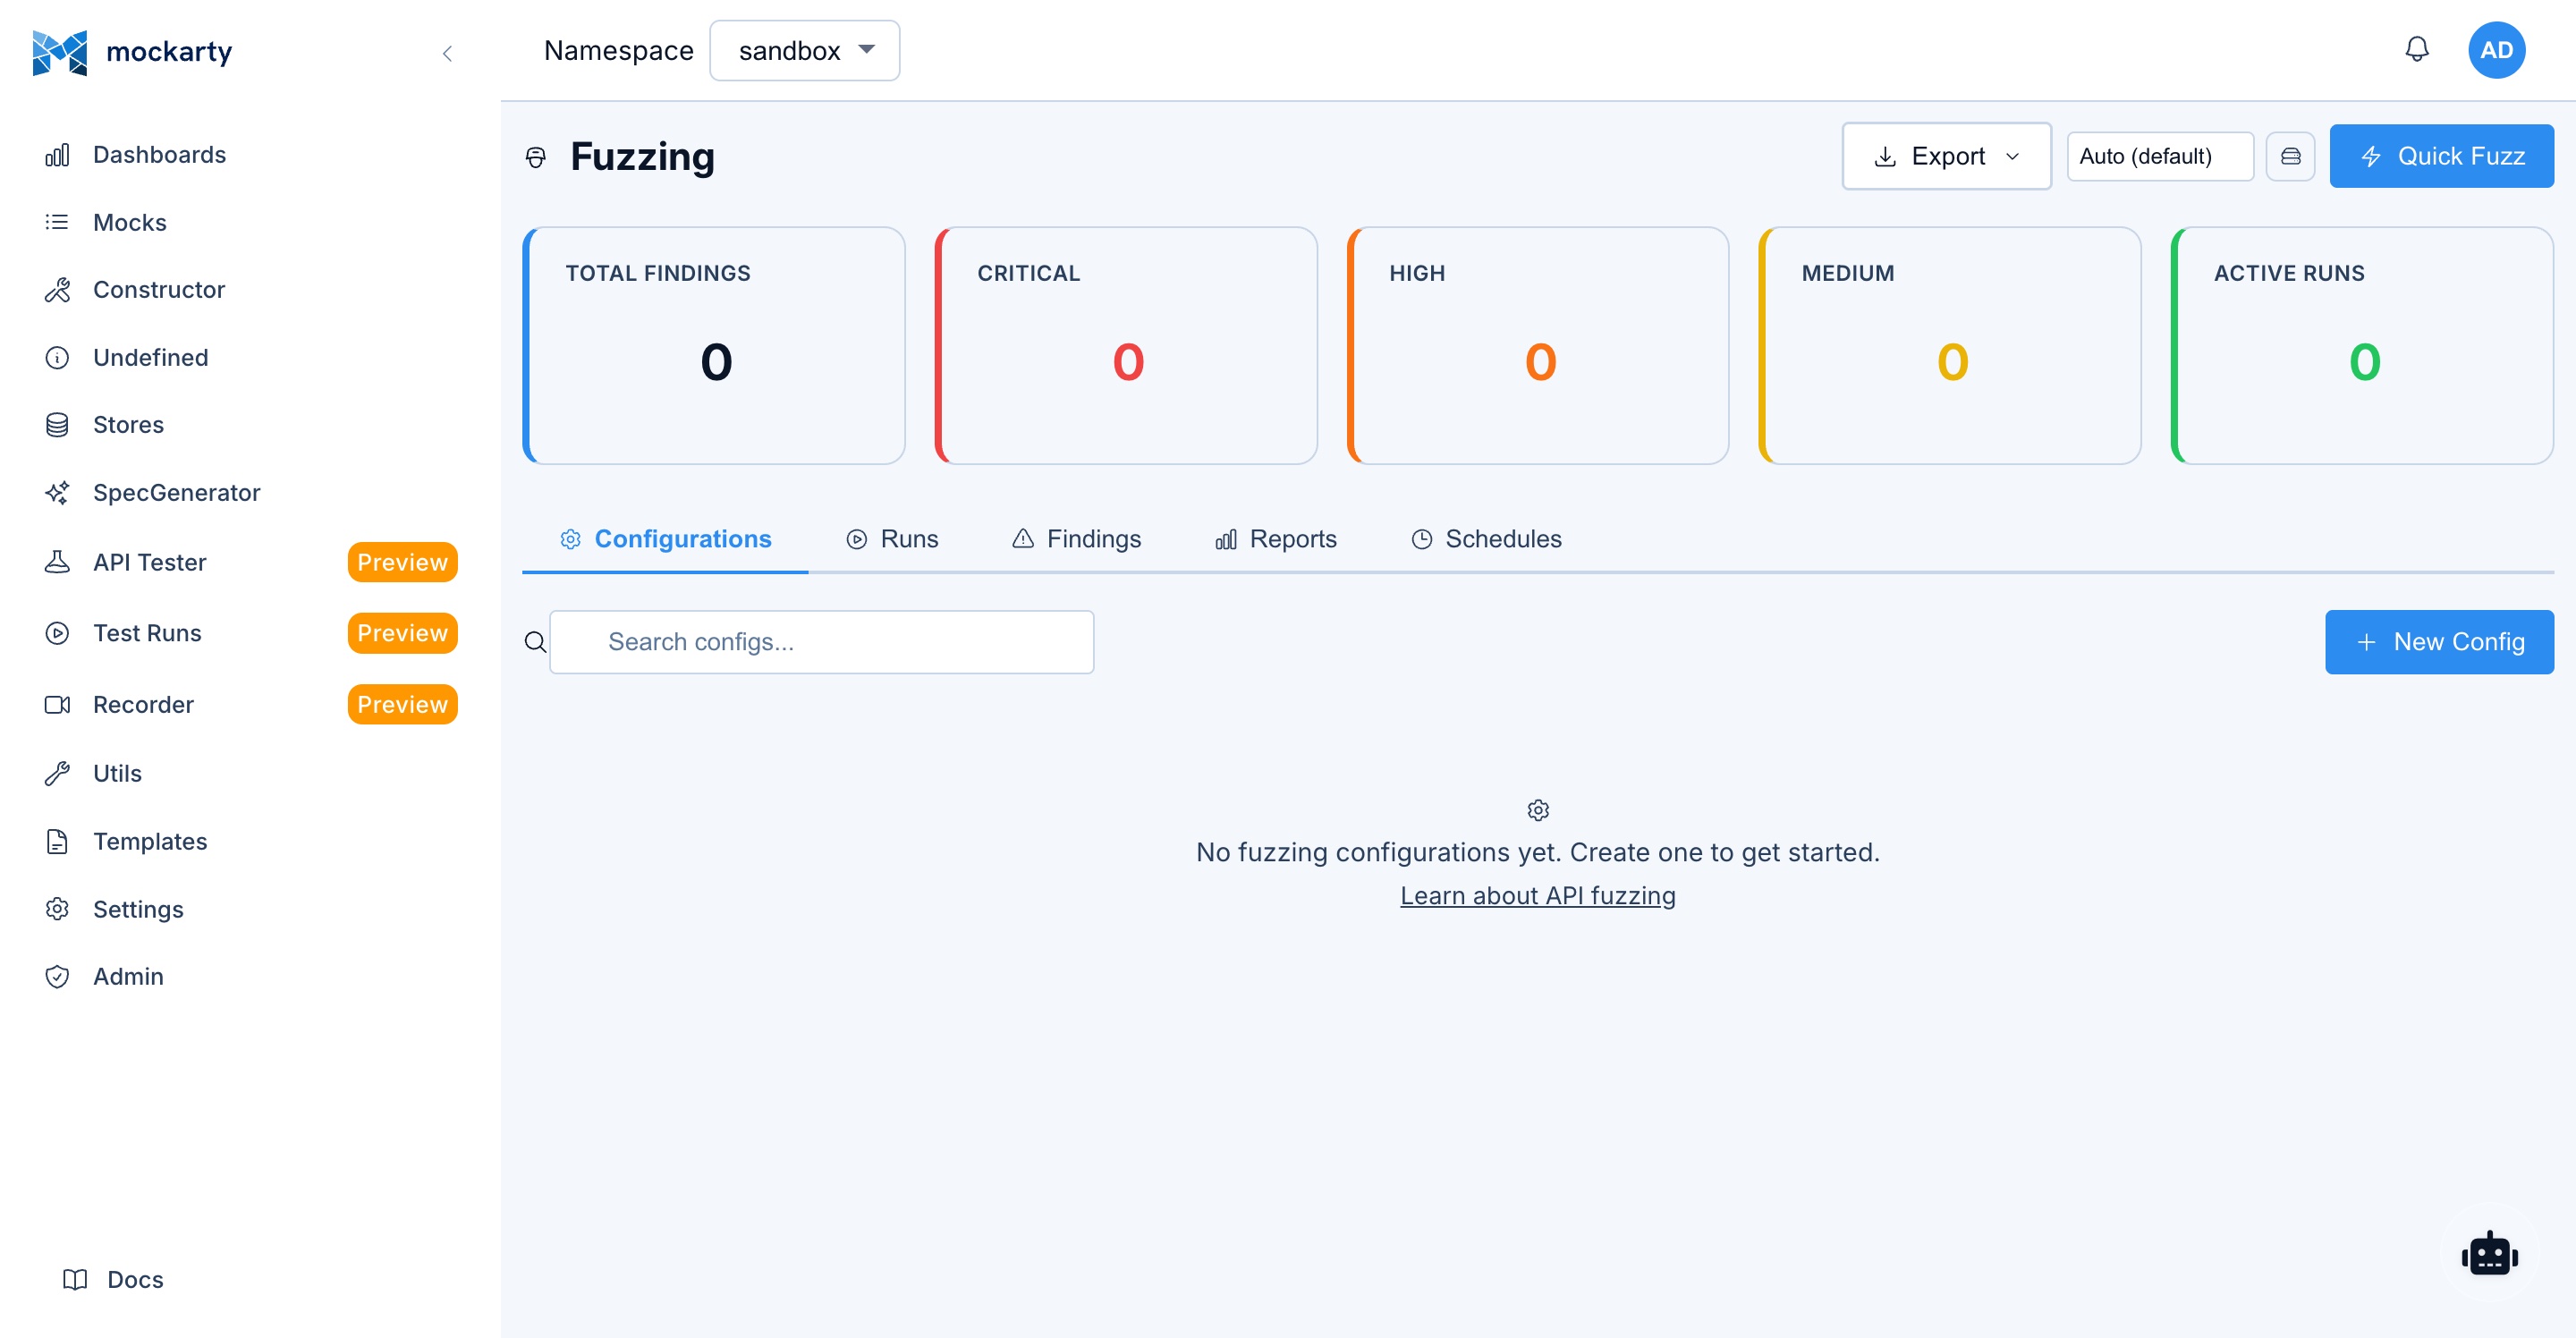
Security (Fuzzing)
Path: /ui/security
Fuzzing is an automated security testing technique. Instead of manually trying edge cases, Mockarty sends thousands of crafted or random inputs to your API endpoints and watches for unexpected behavior – crashes, error leaks, or security vulnerabilities. It is a quick way to find bugs that normal testing often misses.


AI Feature: Click the Analyze Finding button on any fuzzing finding for AI-powered root cause analysis and remediation suggestions. See AI Features for details.
Fuzzing Configurations
Create and manage fuzz test configurations:
- Target URL: The endpoint to fuzz.
- Method: The HTTP method (or protocol type for non-HTTP targets).
- Payload Positions: Mark positions in the request (URL, headers, body) where fuzz payloads will be injected. Positions are marked with placeholder syntax.
- Base request: The template request that fuzzing payloads will be injected into.
- Authentication: Configure authentication for the target (Bearer token, Basic Auth, API Key, etc.).
- Rate limiting: Control the request rate to avoid overwhelming the target.
- Timeout: Maximum response time before considering a request as timed out.
Payload Categories
Mockarty includes built-in payload dictionaries for common vulnerability categories:
- SQL Injection: SQL syntax fragments, UNION-based payloads, blind SQL injection patterns, time-based payloads.
- XSS (Cross-Site Scripting): Script tags, event handlers, encoded payloads, polyglot XSS strings.
- Buffer Overflow: Long strings, repeated characters, format string specifiers.
- Path Traversal: Directory traversal sequences (
../,..%2f), absolute paths, null byte injections. - Command Injection: Shell metacharacters, command separators, backtick execution, pipe chains.
- Format Strings: Printf-style format specifiers, width/precision attacks.
- Header Injection: CRLF injection, header smuggling payloads.
- XXE (XML External Entity): Entity declarations, external references, parameter entities.
- SSRF (Server-Side Request Forgery): Internal IP addresses, cloud metadata URLs, DNS rebinding payloads.
- Authentication Bypass: Default credentials, JWT manipulation, session fixation tokens.
Custom payload lists can also be uploaded or created manually.
Import Targets
Quickly set up fuzzing targets by importing from existing sources:
- cURL commands: Paste a cURL command to extract the URL, method, headers, and body.
- OpenAPI specification: Import an API spec and select endpoints to fuzz.
- API Tester collections: Select requests from your API Tester collections as fuzzing targets.
- Recorder sessions: Use captured traffic as the basis for fuzzing.
- Existing mocks: Select mocks and fuzz their endpoints.
Protocol-Specific Discovery
- GraphQL introspection: Automatically discover queries, mutations, and types by running an introspection query against a GraphQL endpoint.
- gRPC reflection: Discover services and methods using gRPC server reflection.
Running Fuzz Tests
Start a fuzz test from a configuration:
- Progress monitoring: A real-time progress bar shows completion percentage, requests sent, and elapsed time.
- Live statistics: View the current request rate, response code distribution, and error count as the test runs.
- Stop: Stop the running fuzz test and preserve partial results.
Findings
After a fuzz test completes (or during execution), findings are listed with:
- Severity: Critical, High, Medium, Low, or Informational.
- Category: The type of vulnerability detected (SQL Injection, XSS, etc.).
- Payload: The exact payload that triggered the finding.
- Response: The response status code and body excerpt.
- Evidence: Specific patterns in the response that indicate a potential vulnerability (error messages, stack traces, reflected input).
Triage Findings
Review and classify each finding:
- Confirmed: Mark as a real vulnerability that needs to be addressed.
- False Positive: Mark as a false alarm (the behavior is expected or benign).
- Ignored: Dismiss the finding without classification.
Triage status is preserved across sessions and can be exported with the findings report.
Replay Findings
Click “Replay” on any finding to re-send the exact request that triggered it. This is useful for:
- Verifying the finding is reproducible.
- Testing after a fix has been applied.
- Investigating the behavior in more detail.
Export Findings Report
Export all findings (or filtered subsets) as:
- JSON: Machine-readable format for integration with security tools and CI/CD pipelines.
- CSV: Spreadsheet-compatible format for tracking and reporting.
Scheduled Fuzz Runs
Configure fuzzing to run on a schedule (daily, weekly, or custom cron expression). Scheduled runs:
- Execute automatically at the configured time.
- Send notification on completion (when email notifications are enabled).
- Results are available in the Fuzzing page and Test Runs page.
- Compare findings across runs to track security posture over time.
Quick Fuzz Mode
For rapid testing without detailed configuration:
- Enter a target URL and select payload categories.
- Mockarty automatically detects parameters and injection points.
- Results are available within minutes for a quick security assessment.
See also: API Fuzzing
Contract Testing
Path: /ui/contract-testing
Feature gate: This feature is hidden by default and shown when the contract-testing license feature is enabled.


Contract Testing validates that your mocks stay in sync with real API specifications, manages consumer contracts, and provides bidirectional deployment safety checks. Supports all protocols: OpenAPI, gRPC, GraphQL, MCP, AsyncAPI, WSDL.
Tabs
The Contract Testing page is organized into 6 tabs:
1. Validate Mocks
Upload or reference an API specification and validate that your existing mocks conform to it. Supports all spec types (OpenAPI, gRPC proto, GraphQL SDL, MCP JSON, AsyncAPI, WSDL). Select mocks by tags or browse folders. AI analysis available for findings.
2. Can I Deploy?
Bidirectional deployment readiness check with two perspectives:
- As Consumer: Select your consumer contract and verify all provider dependencies are still compatible. Answers: “will my dependencies break me?”
- As Provider: Select your API from the registry and optionally paste a new spec. Answers: “will my changes break consumers?” Useful for pre-deploy impact analysis.
3. Compatibility
Compare two versions of an API specification to detect breaking changes. Two modes:
- Paste: Paste old and new specs side-by-side.
- From Registry: Select an API from the registry and compare two versions from its version history.
Supports all spec types. Shows structural diff with added/removed/changed items and breaking change indicators.
4. Contracts
Manage consumer contracts in two formats:
- Mockarty Contracts (Dependency Bundles): Create via a 4-step visual wizard — select providers from registry, pick endpoints, configure required fields, review and save. One contract can cover multiple provider APIs.
- Pact v3: Standard Pact Broker compatible format for teams using pact-js, pact-jvm, pact-python. Publish via visual builder or raw JSON.
Both formats participate in the unified Can-I-Deploy matrix and health dashboard.
5. API Registry
Internal API marketplace where teams publish their API specifications. Features:
- Publish APIs with visibility control (public, internal, restricted).
- Protocol-specific UX — placeholders and hints adapt to the selected spec type.
- Auto-refresh for URL-based entries — Mockarty periodically fetches updated specs (configurable interval).
- Version history with diff visualization and rollback.
- Review workflow (draft → pending review → active/deprecated).
- Subscribe to API changes and get notified on breaking changes.
6. History & Health
- History: Timeline of all validation runs with expandable results, trend chart (60-day compliance).
- Health Dashboard: Traffic-light status (green/yellow/red) for each contract. Shows overall namespace health. Monitors provider availability and spec changes.
- Scheduled Monitors: Configure cron-based validation runs with notifications.
Consumer Contract Wizard
The wizard guides you through creating a contract in 4 steps:
- Select Providers — search and pick APIs from the registry (any protocol).
- Select Endpoints — browse parsed endpoints, check the ones your service depends on.
- Configure Requirements — mark required response fields, expected status codes, type constraints. Fields from the spec are pre-populated.
- Review & Save — name your contract, review the summary, save.
AI Features
- AI Analyze: Get LLM-powered analysis of validation findings with fix suggestions (rendered as markdown).
- Auto-Triage: Automatically classify findings by severity and priority.
- Available on all result panels (validation, drift detection, pact verification).
See also: Contract Testing Guide
Chaos Engineering
Path: /ui/chaos
Feature gate: This feature is hidden by default and shown when the chaos license feature is enabled. Requires a connected Kubernetes cluster.


Chaos Engineering lets you test system resilience by injecting controlled faults into your Kubernetes infrastructure. Instead of waiting for outages to discover weaknesses, you proactively run experiments that kill pods, inject network latency, disrupt DNS, or stress resources – and observe whether your system recovers gracefully.
Cluster Topology
The first tab shows a live visualization of your Kubernetes cluster using an interactive graph (powered by Cytoscape.js):
- Namespaces, Deployments, Pods: Displayed as nodes in a directed graph with automatic layout.
- Health indicators: Nodes are color-coded by health status (green = healthy, yellow = degraded, red = failing).
- Selection: Click any node to see its details (labels, resource usage, events) in a side panel.
- Zoom and pan: Use mouse wheel or on-screen controls to navigate large clusters.
- Refresh: Topology updates on demand or at a configurable interval.
Experiment Types
Mockarty supports 12 fault injection types:
| Fault Type | Description |
|---|---|
| Pod Kill | Terminate one or more pods to test restart behavior |
| Pod Failure | Make pods unresponsive without terminating them |
| Container Kill | Kill specific containers within a pod |
| Network Partition | Isolate pods from each other or from external services |
| Network Latency | Inject artificial network delay between services |
| Network Loss | Drop a percentage of network packets |
| Network Bandwidth | Throttle network bandwidth |
| DNS Disruption | Return errors or incorrect results for DNS lookups |
| I/O Chaos | Inject latency or errors into filesystem operations |
| CPU Stress | Consume CPU resources to simulate resource contention |
| Memory Stress | Consume memory to simulate memory pressure |
| Time Skew | Shift the system clock forward or backward |
Creating an Experiment
To create a new chaos experiment:
- Select fault type: Choose from the 12 supported fault types.
- Define targets: Select target pods by namespace, label selector, or specific pod names. Set a blast radius limit (e.g., affect at most 50% of matching pods).
- Configure parameters: Each fault type has specific parameters (e.g., latency duration in milliseconds, packet loss percentage, CPU cores to stress).
- Set duration: How long the fault should be active before automatic rollback.
- Add steady-state probes: Define health checks that validate your system during and after the experiment (HTTP endpoint probes, Prometheus metric queries, pod count assertions).
- Safety guardrails: Configure namespace deny lists, maximum blast radius, and auto-rollback conditions.
Running Experiments
Start an experiment and monitor it in real time:
- Progress timeline: Visual timeline showing injection start, steady-state checks, and rollback.
- Live probe results: Steady-state probes run continuously and display pass/fail status as the experiment progresses.
- Emergency stop: A prominent red button immediately rolls back all active faults if something goes wrong.
- Auto-rollback: Experiments automatically rollback when duration expires or when a steady-state probe fails (configurable).
Experiment Results
After an experiment completes, the results include:
- Verdict: Pass (system remained healthy) or Fail (steady-state probes detected degradation).
- Timeline: Complete event log with timestamps for injection, probe checks, and rollback.
- Probe details: Each probe’s results with expected vs. actual values.
- Affected resources: List of pods/containers that were targeted.
- Recovery time: How long the system took to return to steady state after rollback.
Presets
Mockarty includes pre-built experiment presets for common scenarios:
- Chaos Monkey: Random pod kill in selected namespace.
- Network Partition: Isolate a service from its dependencies.
- Scale to Zero: Kill all pods of a deployment and measure recovery.
- Slow Network: Inject increasing latency to find timeout thresholds.
- Resource Starvation: Stress CPU and memory to test autoscaling.
Presets can be customized before running and saved as new templates.
Scheduling
Configure experiments to run on a recurring schedule:
- Cron expressions: Standard cron syntax for flexible scheduling.
- Notifications: Receive alerts via configured notification channels when experiments complete.
- Trend analysis: Compare results across scheduled runs to track resilience improvements.
Reports
Export experiment results in multiple formats:
- JSON: Machine-readable format for CI/CD integration.
- HTML: Human-readable report with charts and timeline visualization.
- JUnit XML: Compatible with CI/CD test result parsers (Jenkins, GitLab CI, etc.).
See also: Chaos Engineering Guide
Utils
Path: /ui/utils
The Utils page provides a collection of developer utilities for common data format conversions and generation tasks. These tools run entirely in the browser and do not send data to the server.
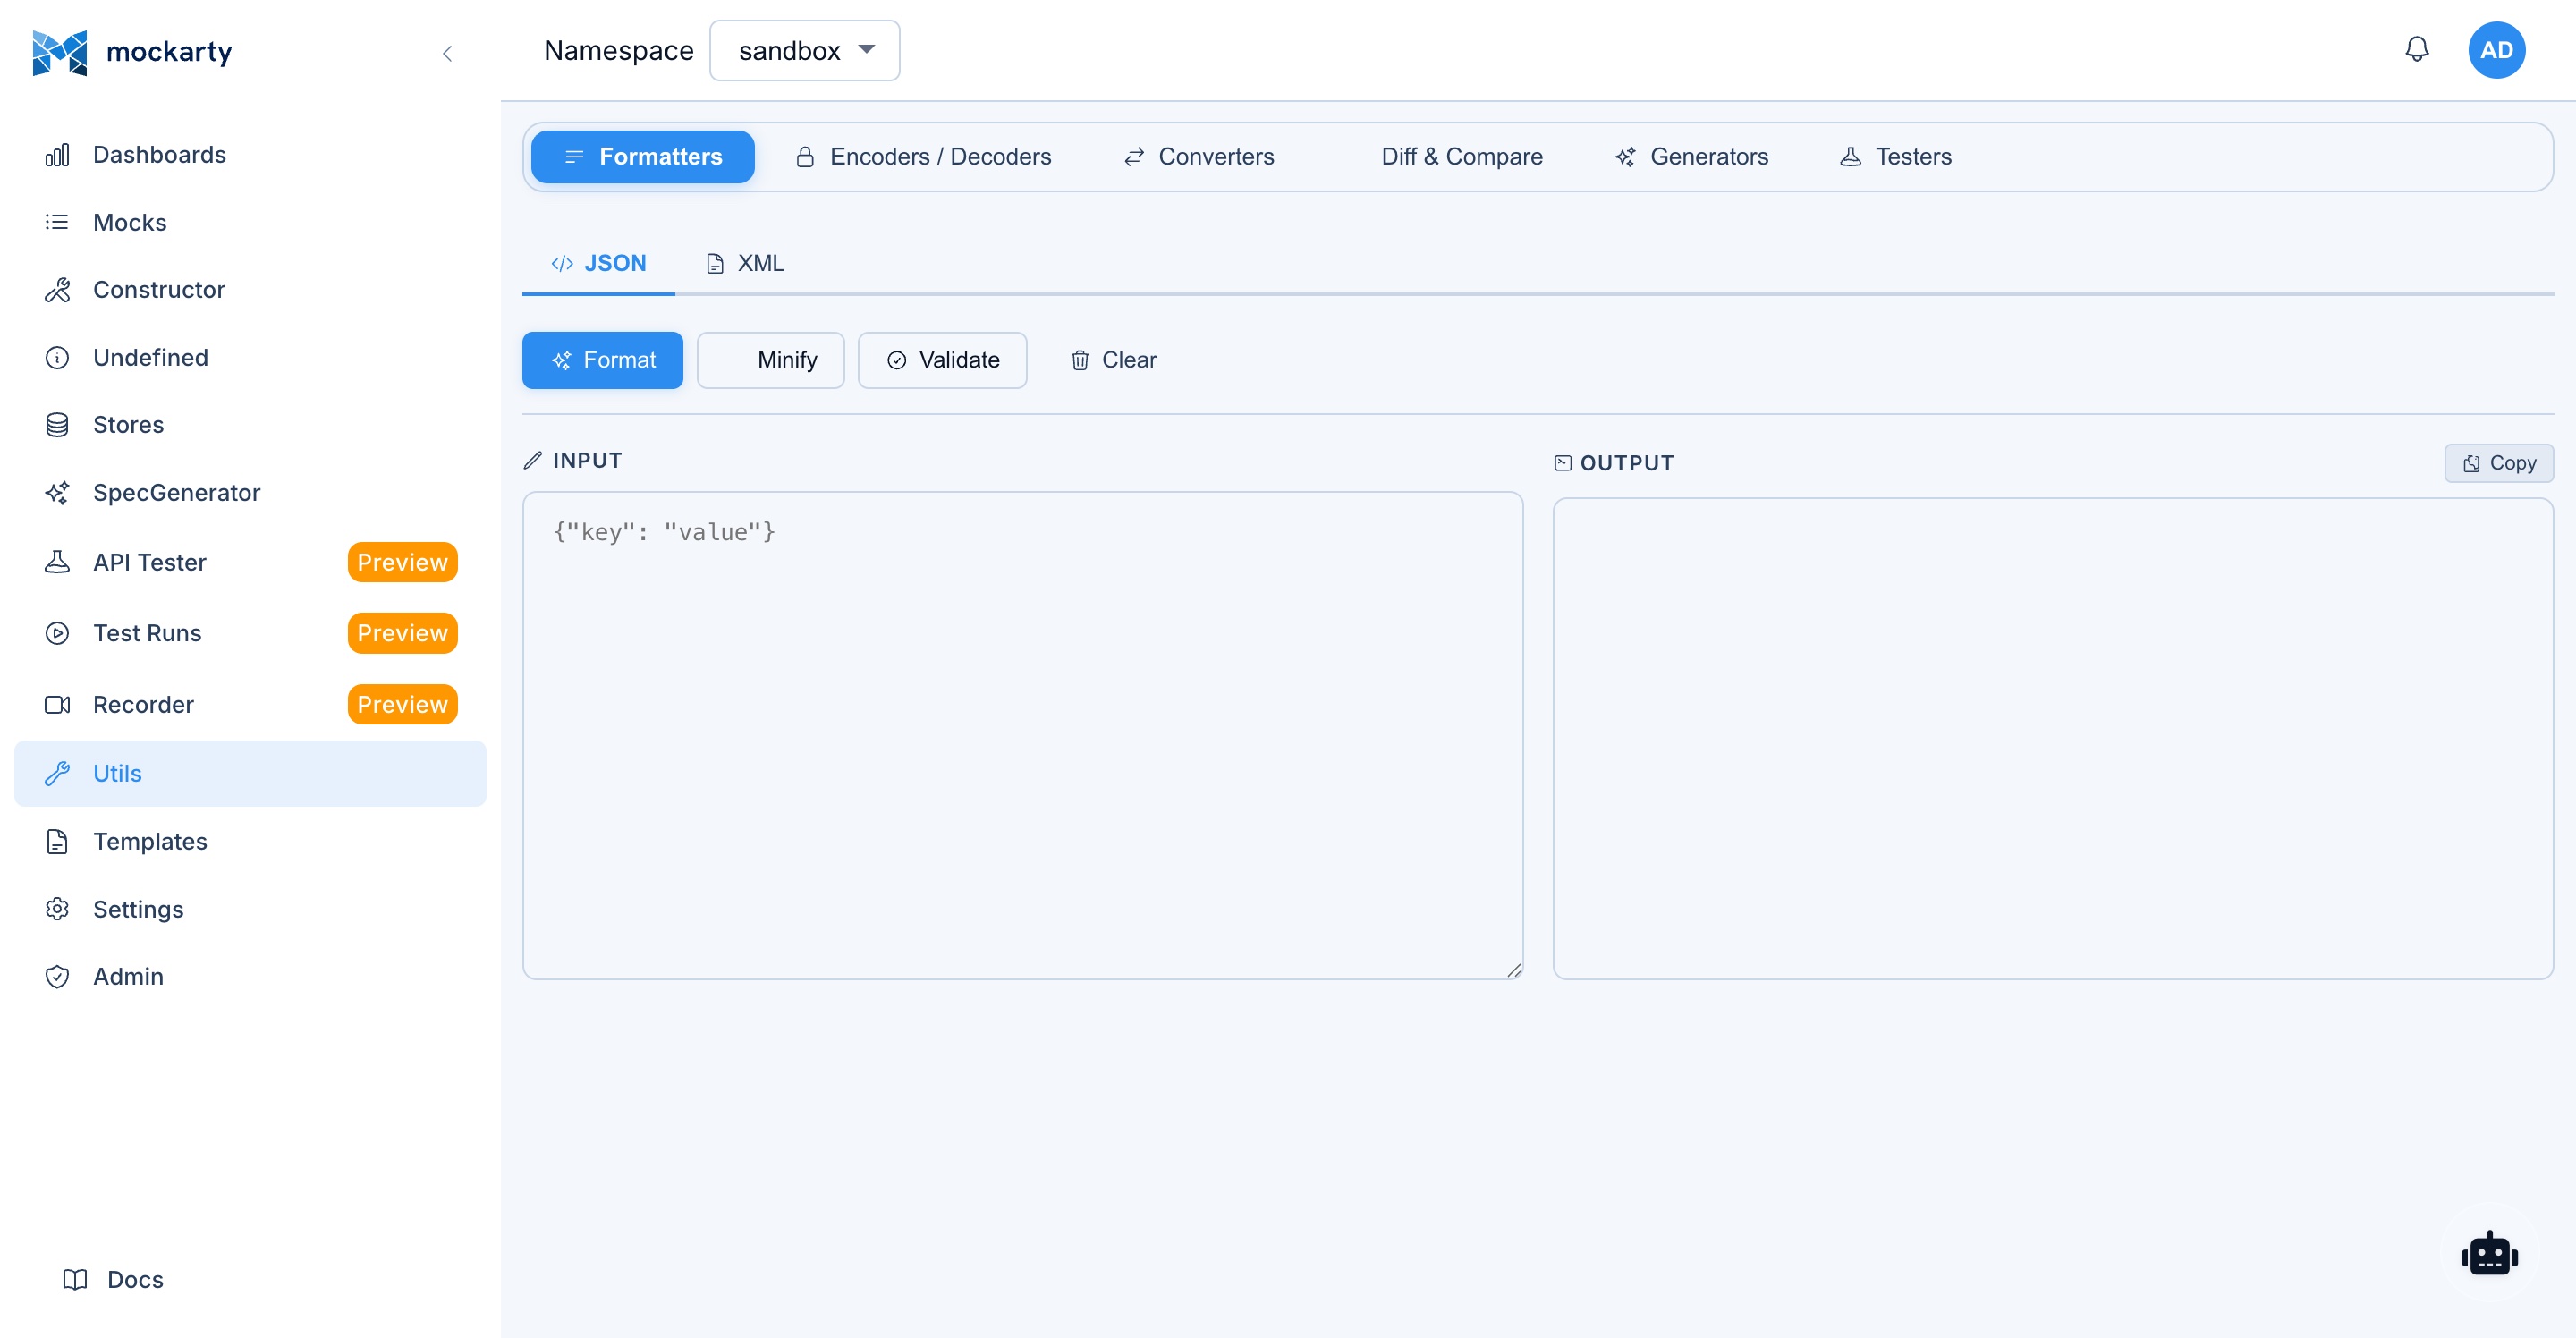
JSON Formatter and Validator
- Paste or type JSON in the input area.
- Click “Format” to pretty-print the JSON with proper indentation.
- Click “Minify” to compress the JSON to a single line.
- Validation errors are highlighted with line numbers and error descriptions.
- Copy the formatted output to clipboard with one click.
UUID Generator
- Generate random UUID v4 values.
- Generate multiple UUIDs at once (configurable count).
- Copy individual UUIDs or the entire list to clipboard.
Base64 Encoder/Decoder
- Encode: Paste plain text and encode it to Base64.
- Decode: Paste a Base64 string and decode it to plain text.
- Supports standard and URL-safe Base64 variants.
- Handles multi-line input.
URL Encoder/Decoder
- Encode: Encode special characters in a URL or URL component.
- Decode: Decode percent-encoded characters back to their original form.
- Encode/decode the full URL or individual components.
JWT Decoder
- Paste a JWT (JSON Web Token) to decode its header, payload, and signature.
- The header and payload are displayed as formatted JSON.
- Expiration time is shown in human-readable format with an indication of whether the token has expired.
- Signature verification is not performed (the decoder does not validate signatures).
Timestamp Converter
- Convert between Unix timestamps (seconds and milliseconds) and human-readable date/time formats.
- Display the current timestamp with a live-updating counter.
- Support for multiple date/time formats (ISO 8601, RFC 2822, custom).
- Timezone-aware conversion with timezone selector.
Hash Generators
Generate cryptographic hashes from input text:
- MD5: 128-bit hash (not recommended for security, useful for checksums).
- SHA-1: 160-bit hash.
- SHA-256: 256-bit hash (recommended for general use).
Input can be pasted or typed. The hash is computed in real time as you type.
Templates
Path: /ui/stores?tab=templates-store (formerly /ui/templates — the old URL still redirects here).
Templates are response-body files that mocks reference by name. They live as a tab inside the Storages page alongside Global / Chain / Mock / Prompts / Secrets / S3 stores.
Template File Management
- Upload: Click “Upload template” to push a file from your local machine. Any text or binary file is accepted (
.json,.yaml,.xml,.html,.txt, images, etc.). The file is stored namespace-scoped on the server. - Type filter: All / JSON / YAML / XML / HTML / Other pills above the list narrow the view by file extension.
- Search: Filter by file name.
- Preview (eye icon): Opens a modal showing the file content. Text files render inline; images preview as
<img>; binary files prompt to download. - Edit (pencil icon): Opens the same modal in editor mode. Make changes, then Save to persist them — or Cancel to discard. The Format button pretty-prints JSON / XML in place; Fullscreen expands the modal to fill the screen for large files.
- Download / Delete: Per-row, and also available in the modal footer when a file is open.
Template Reference
Templates use Go’s text/template syntax with Mockarty’s custom functions:
- Faker functions: All Faker functions available in inline payloads are also available in templates (e.g.,
{{fake "UUID"}},{{fake "FirstName"}}). - JsonPath interpolation: Access request data within templates (e.g.,
{{jsonpath "$.user.id"}}). - Store references: Read and write store values in templates.
- Control structures: Use Go template conditionals (
{{if}},{{else}}), loops ({{range}}), and other constructs for complex response logic. - Template composition: Include one template within another using
{{template "name"}}.
Using Templates in Mocks
When creating or editing a mock in the Constructor, set payloadTemplatePath to the template file name instead of providing an inline response payload. The template is rendered at request time with access to the full request context.
Settings
Path: /ui/settings
Access restriction: The Settings page is only visible to users with the Admin or Support system role. Users with the standard “User” or “Auditor” role do not see the Settings item in the sidebar and cannot access this page.
The Settings page is where you configure how your namespace behaves: who has access, how long logs are retained, which webhooks fire on events, and how the AI assistant is configured. Namespace owners and administrators use this page frequently.
Settings are scoped to the currently selected namespace and affect all users within it.
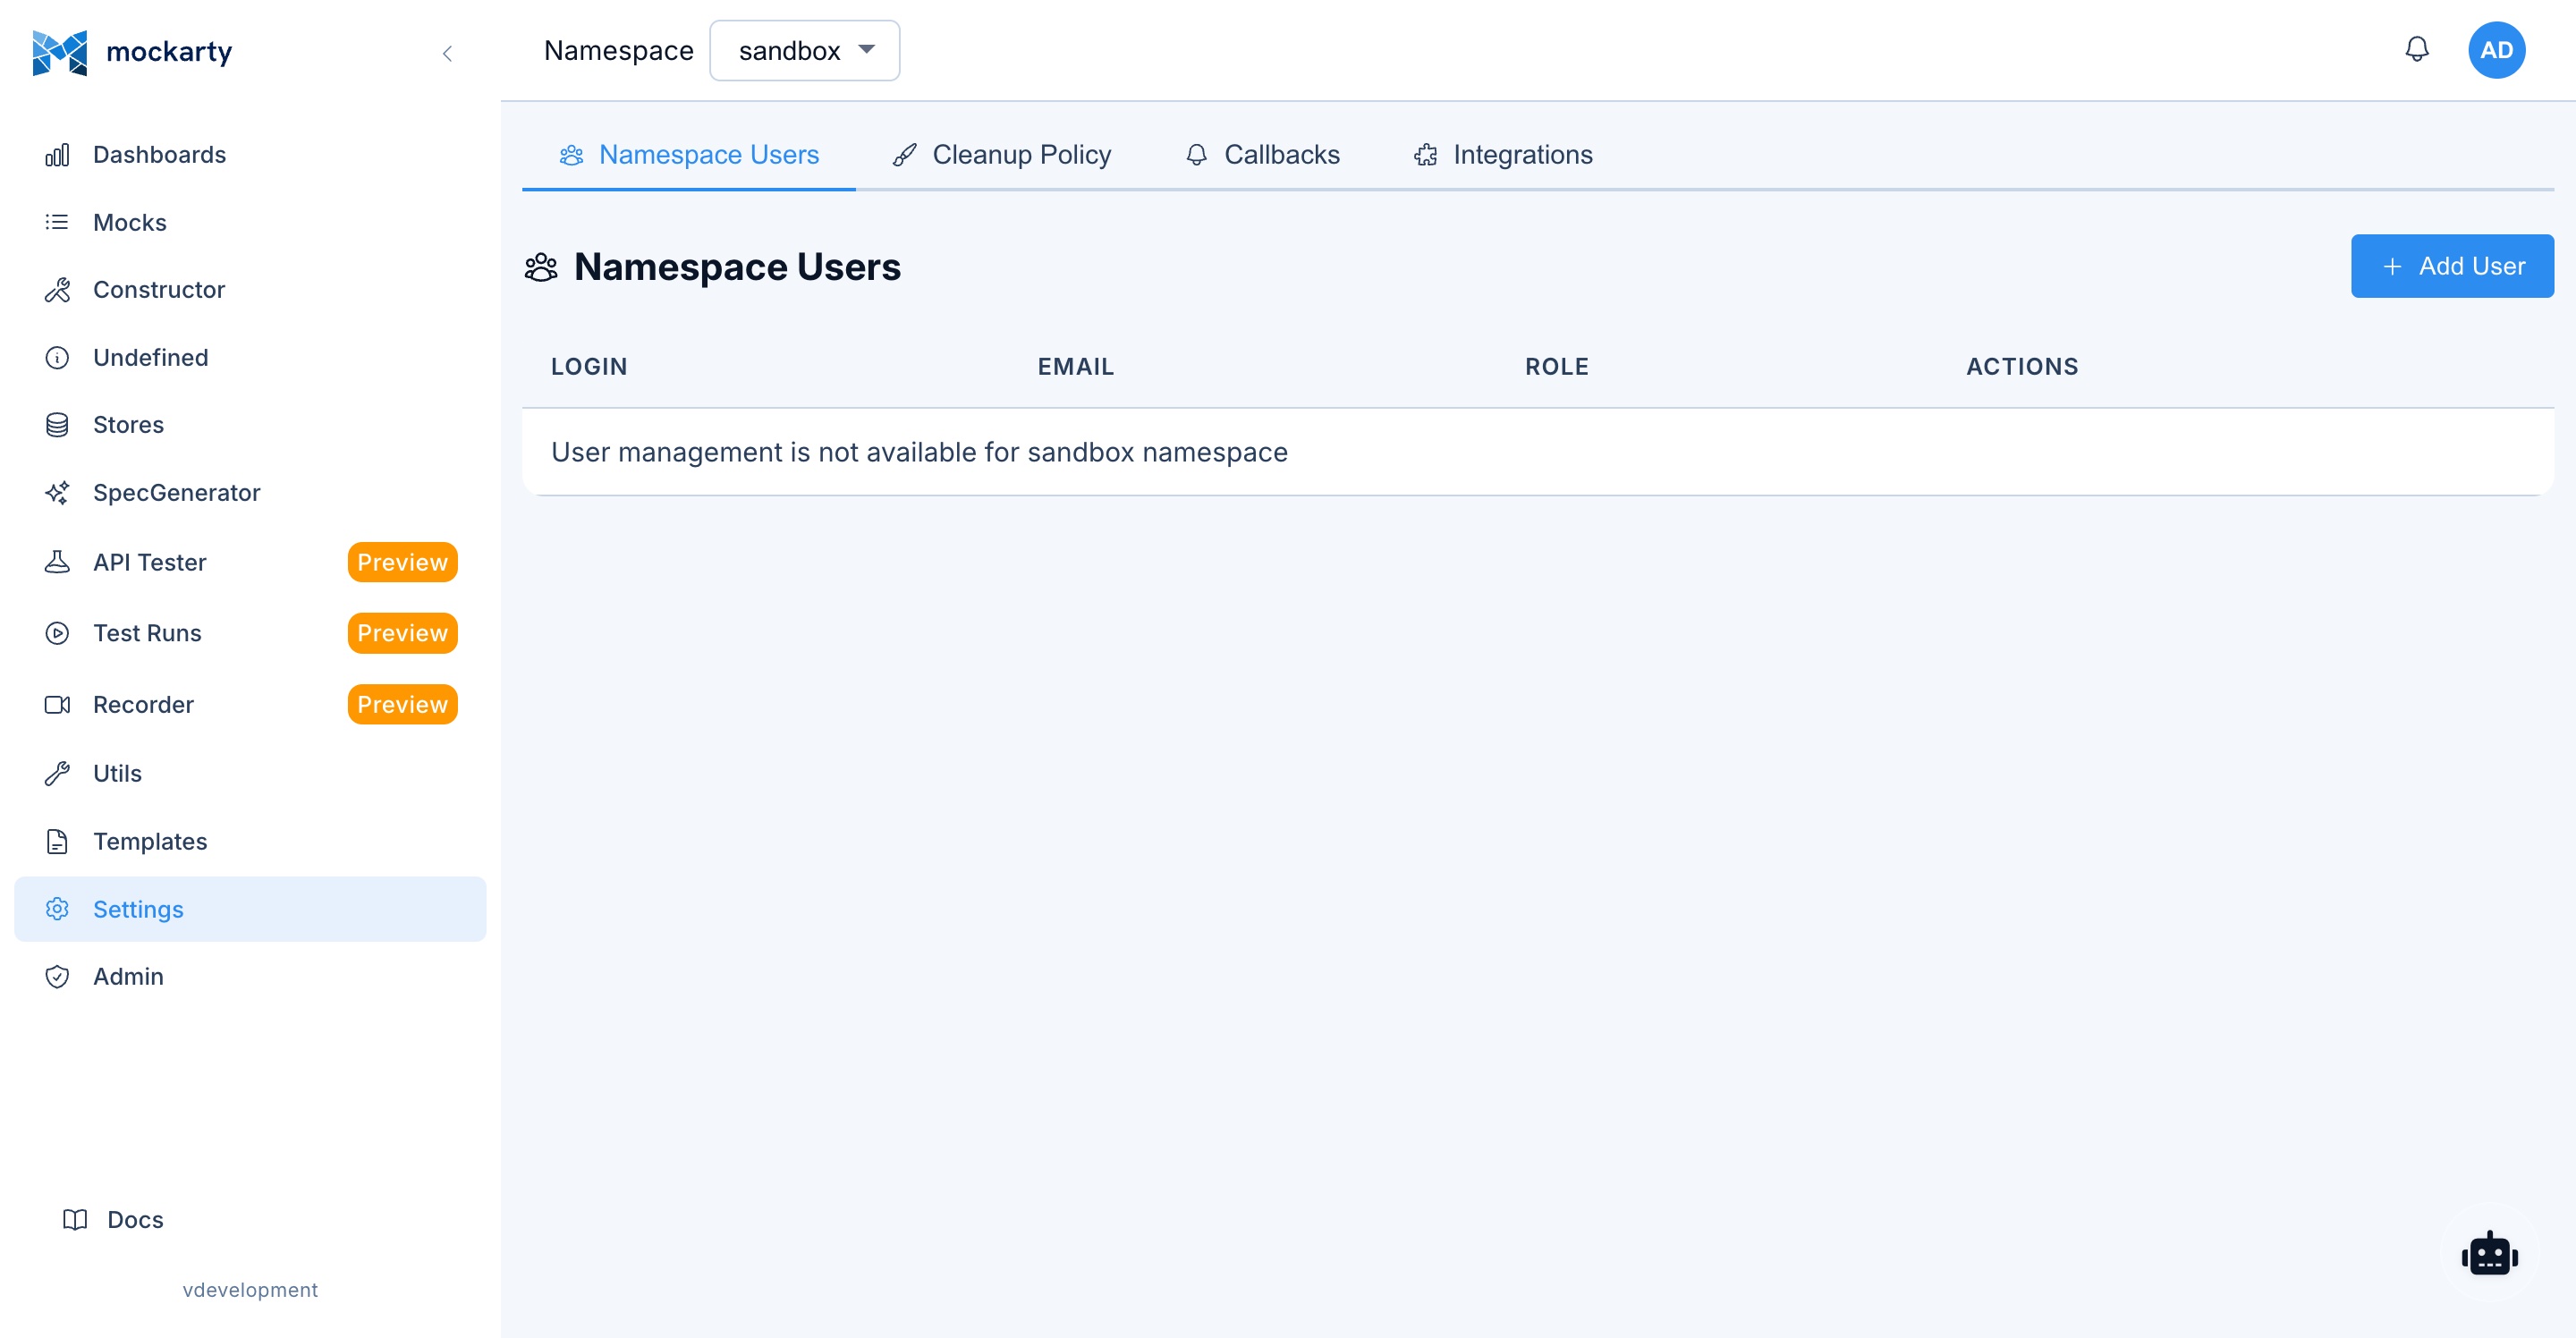

Namespace Management
- View current namespace: See the namespace name, description, creation date, and member count.
- Create namespace: Click “New Namespace” to create a new namespace. Provide a name and optional description.
- Switch namespace: Select a different namespace from the namespace selector in the top bar.
- Namespace isolation: Each namespace has its own mocks, stores, test collections, and settings. Resources are not shared across namespaces unless explicitly configured.
User Management Within Namespace
Manage which users have access to the current namespace and their roles:
- View members: See all users assigned to the current namespace with their roles.
- Add user: Invite a user to the namespace by selecting their account and assigning a role.
- Change role: Update a user’s role within the namespace.
- Remove user: Revoke a user’s access to the namespace.
Namespace roles:
| Role | Permissions |
|---|---|
| Owner | Full control over namespace settings, users, and all resources. Can delete the namespace. |
| Editor | Create, edit, and delete mocks, stores, collections, and run tests. Cannot manage namespace settings or users. |
| Viewer | Read-only access to all resources. Cannot create, edit, or delete anything. |
Cleanup Policies
Configure automatic cleanup of transient data:
- Request logs retention: How long to keep mock request logs (e.g., 7 days, 30 days, forever).
- Undefined requests retention: How long to keep unmatched request records.
- Test report retention: How long to keep test run results.
- Expired mock handling: Whether to automatically delete or archive mocks that have exceeded their TTL or usage limits.
Webhooks
Configure HTTP callbacks triggered by specific events (see Webhooks & Callbacks for details):
- Event types: Mock resolved, mock created, mock deleted, test run completed, undefined request received.
- Target URL: The URL to send the webhook POST request to.
- Headers: Custom headers to include in the webhook request (e.g., authentication tokens).
- Payload format: JSON payload with event details, timestamps, and relevant resource data.
- Retry policy: Number of retries and backoff strategy for failed webhook deliveries.
Notification Channels
Configure notification delivery channels for system events, alerts, and test run results:
- Telegram: Connect a Telegram bot to receive notifications in a chat or group.
- Email: Configure SMTP-based email notifications for users and teams.
- Webhooks: Send event payloads to external HTTP endpoints.
- Slack: Send notifications to Slack channels via incoming webhooks.
- Discord: Send notifications to Discord channels via webhooks.
Each channel can be enabled or disabled independently, and events can be routed to specific channels. For full details, see Notification Channels.
LLM Configuration
Configure the AI assistant (Agent Chat) settings:
- Model selection: Choose the LLM model to use (OpenAI, Claude, OpenRouter, or custom provider).
- API key: Provide the API key for the selected LLM provider.
- Temperature: Adjust the creativity/randomness of AI responses (0.0 for deterministic, 1.0 for creative).
- Context settings: Configure how much mock context the AI assistant receives.
Integrations
Manage integration tokens for runner agents and mock resolvers (see Integrations Guide and Scaling Architecture for multi-node setup):
- Create token: Generate a new integration token (
mki_*format) for a runner agent or mock resolver. - View tokens: See all active integration tokens with their type, scope, and last-used timestamp.
- Revoke token: Disable an integration token immediately.
- Token types: Test runner (for executing test runs on remote agents), Mock resolver (for distributed mock resolution), Orchestrator (for multi-node coordination).
Admin Panel
Path: /ui/admin
The Admin Panel provides system-wide administration capabilities. Access is restricted to users with the Admin system role. See the Administration Guide for detailed setup instructions.
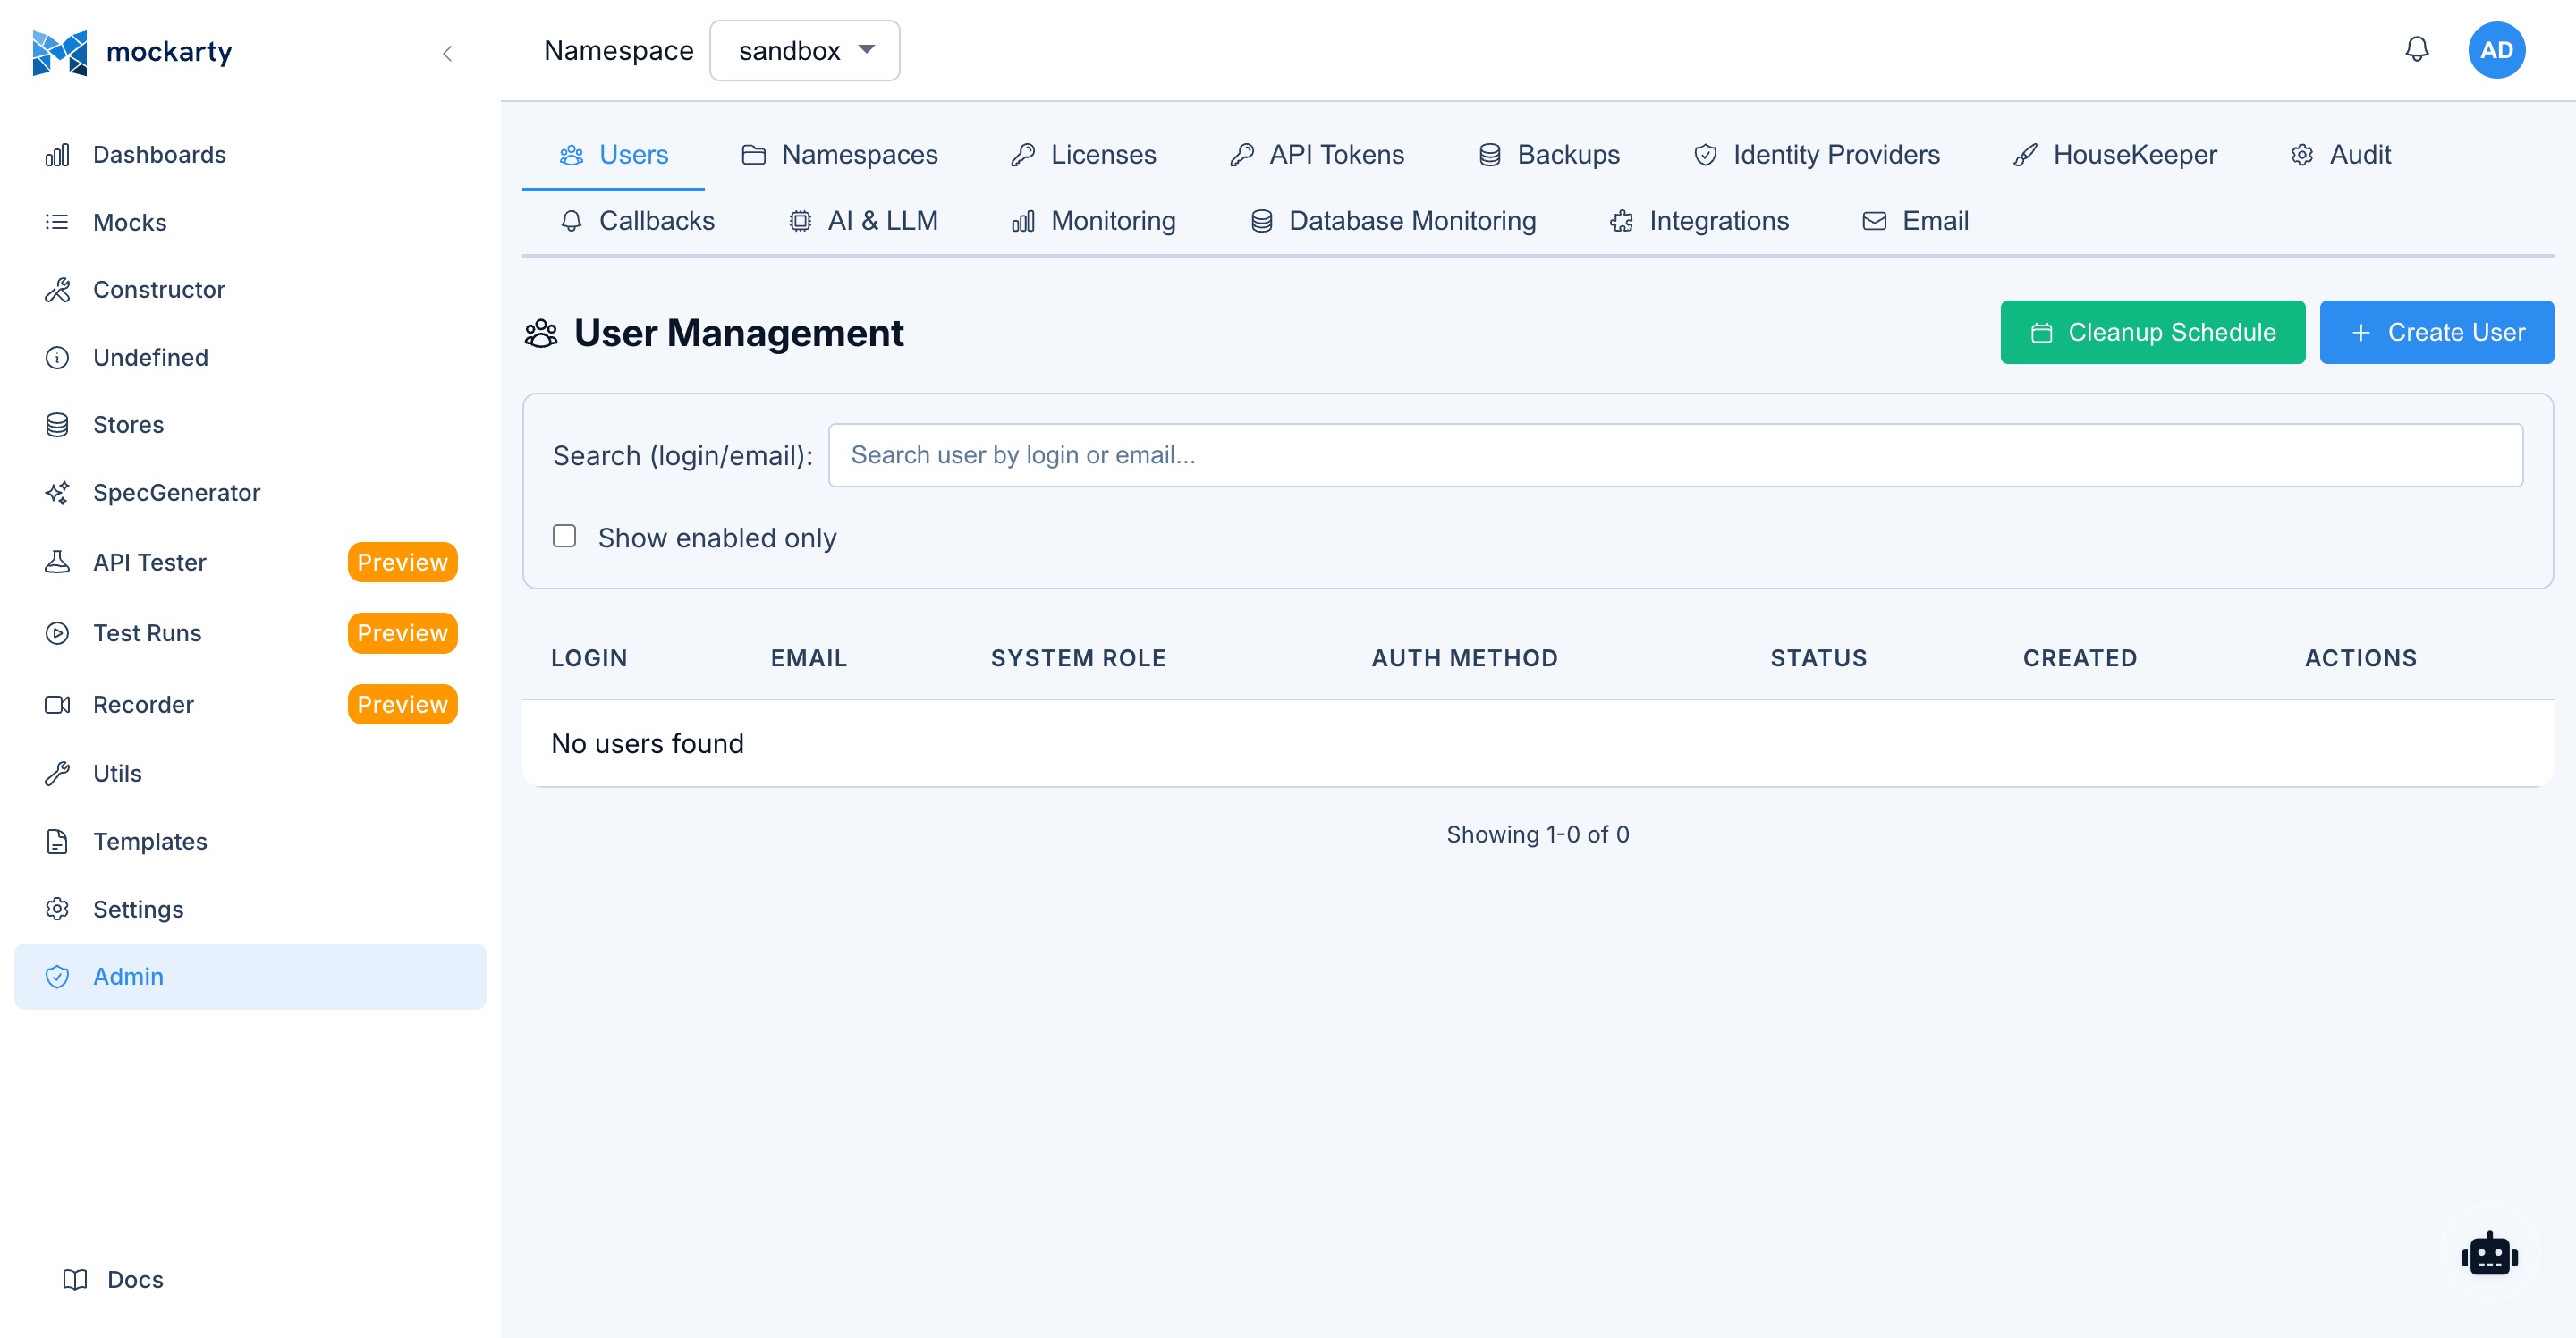
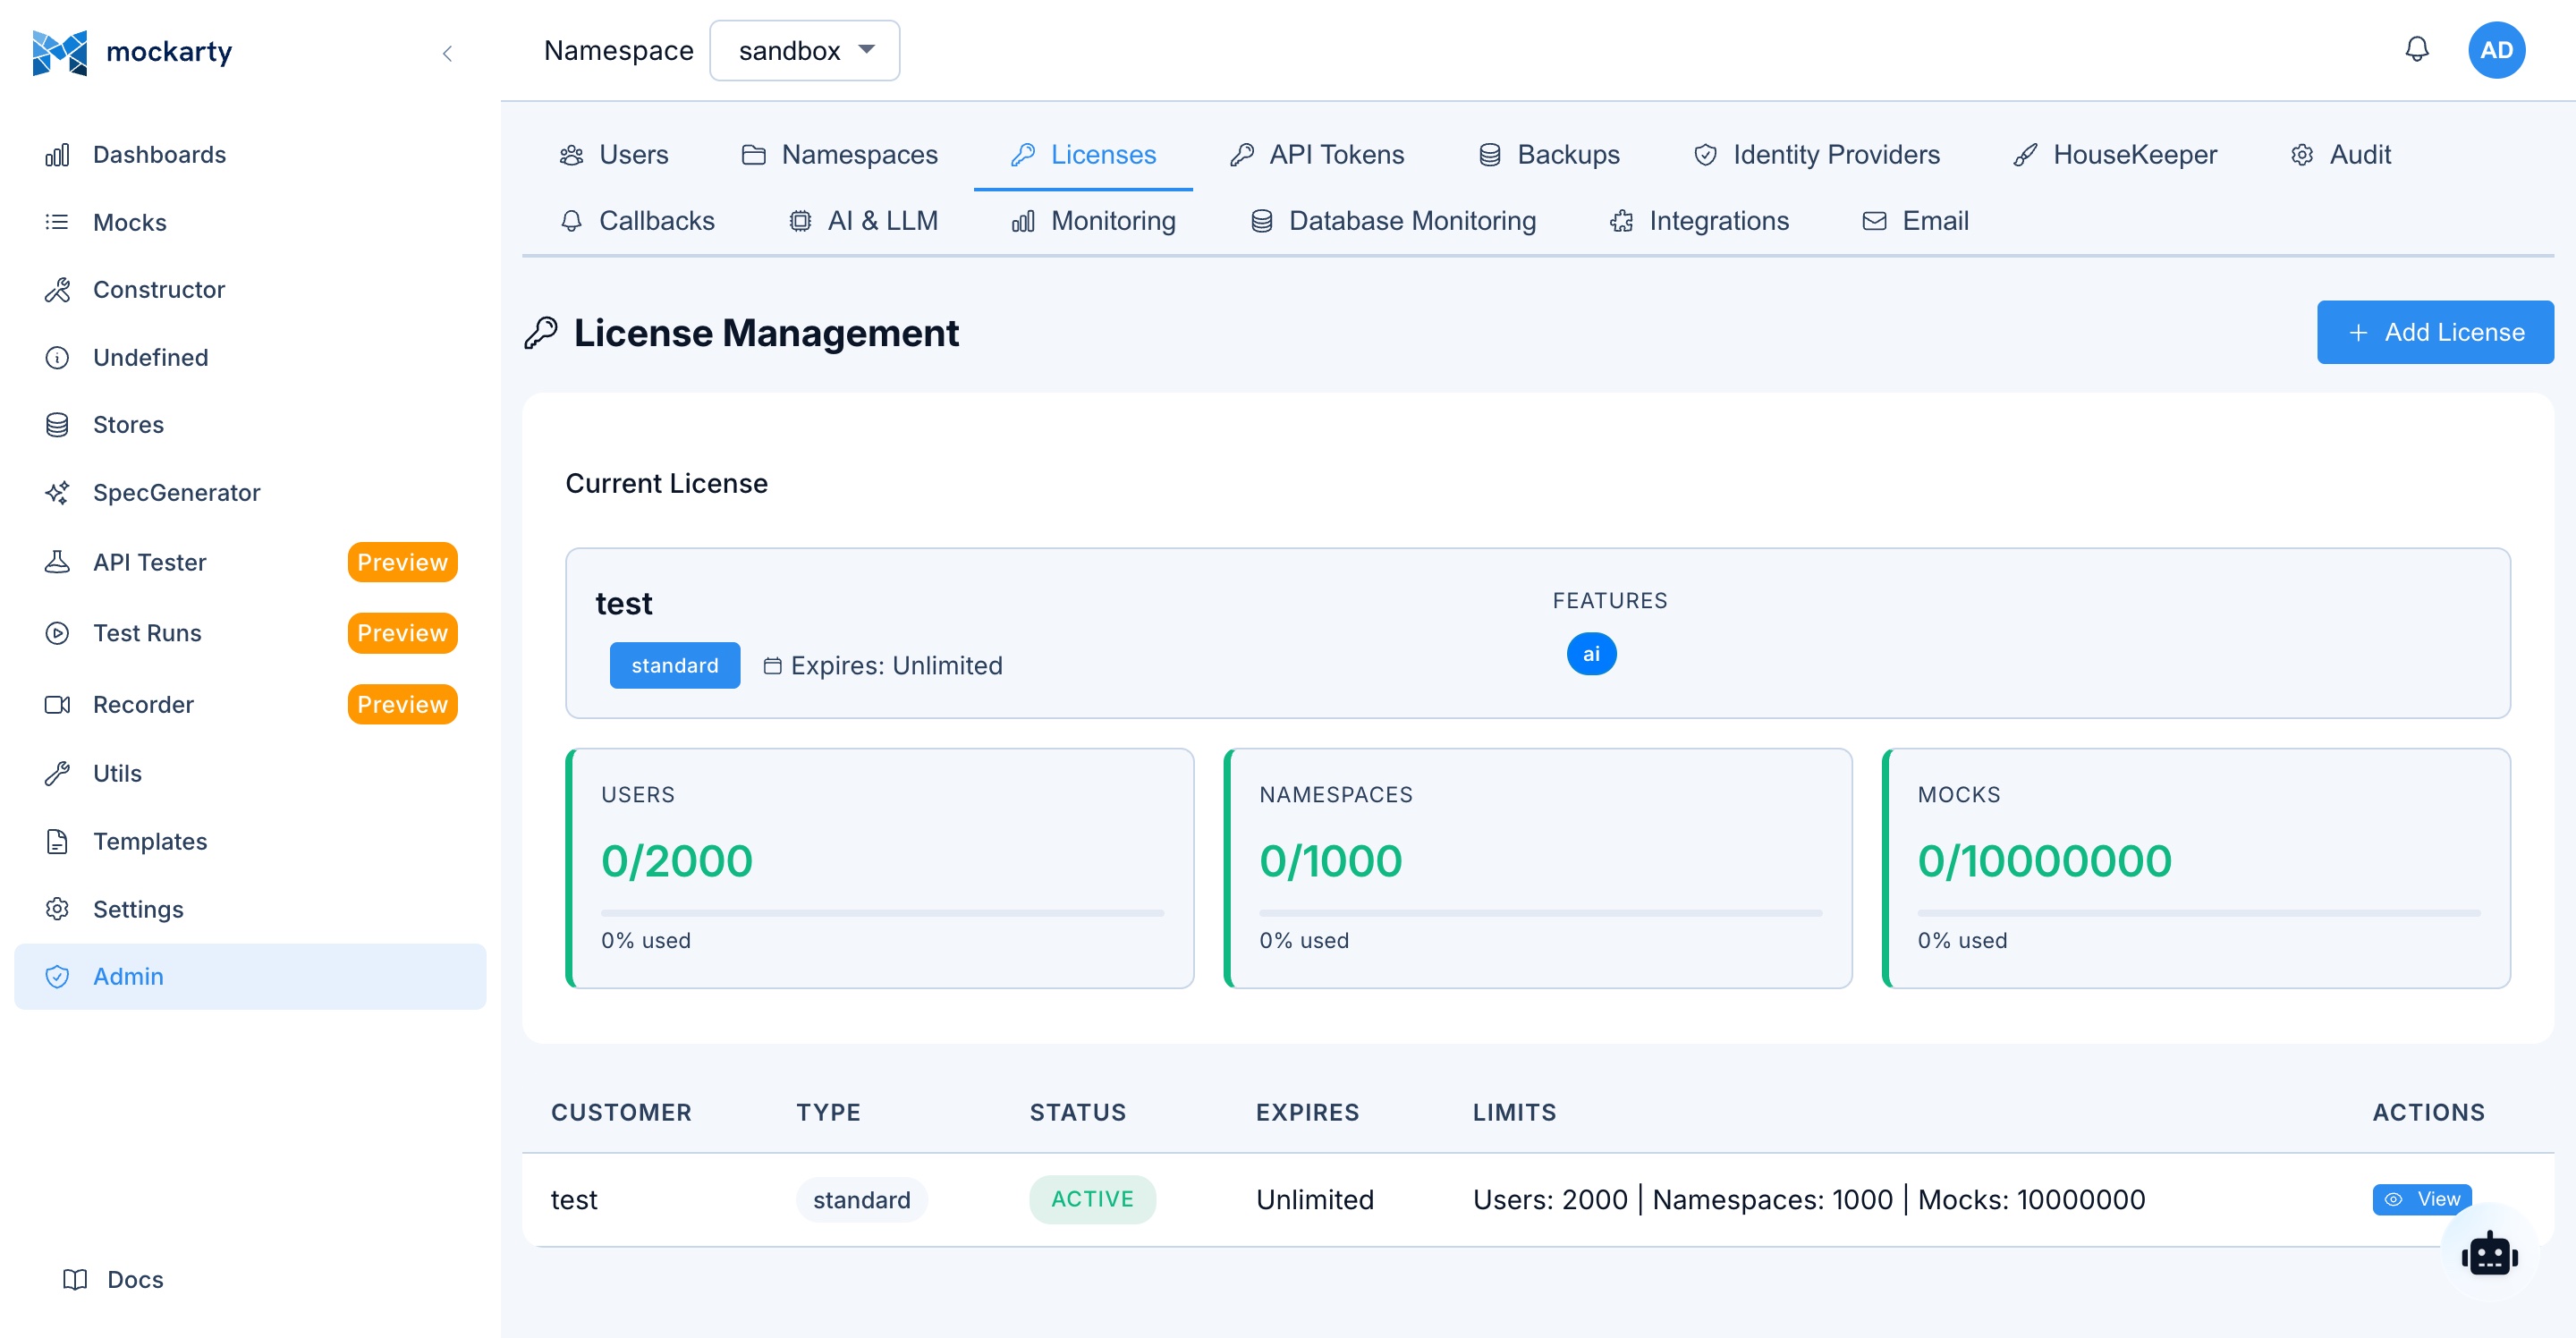
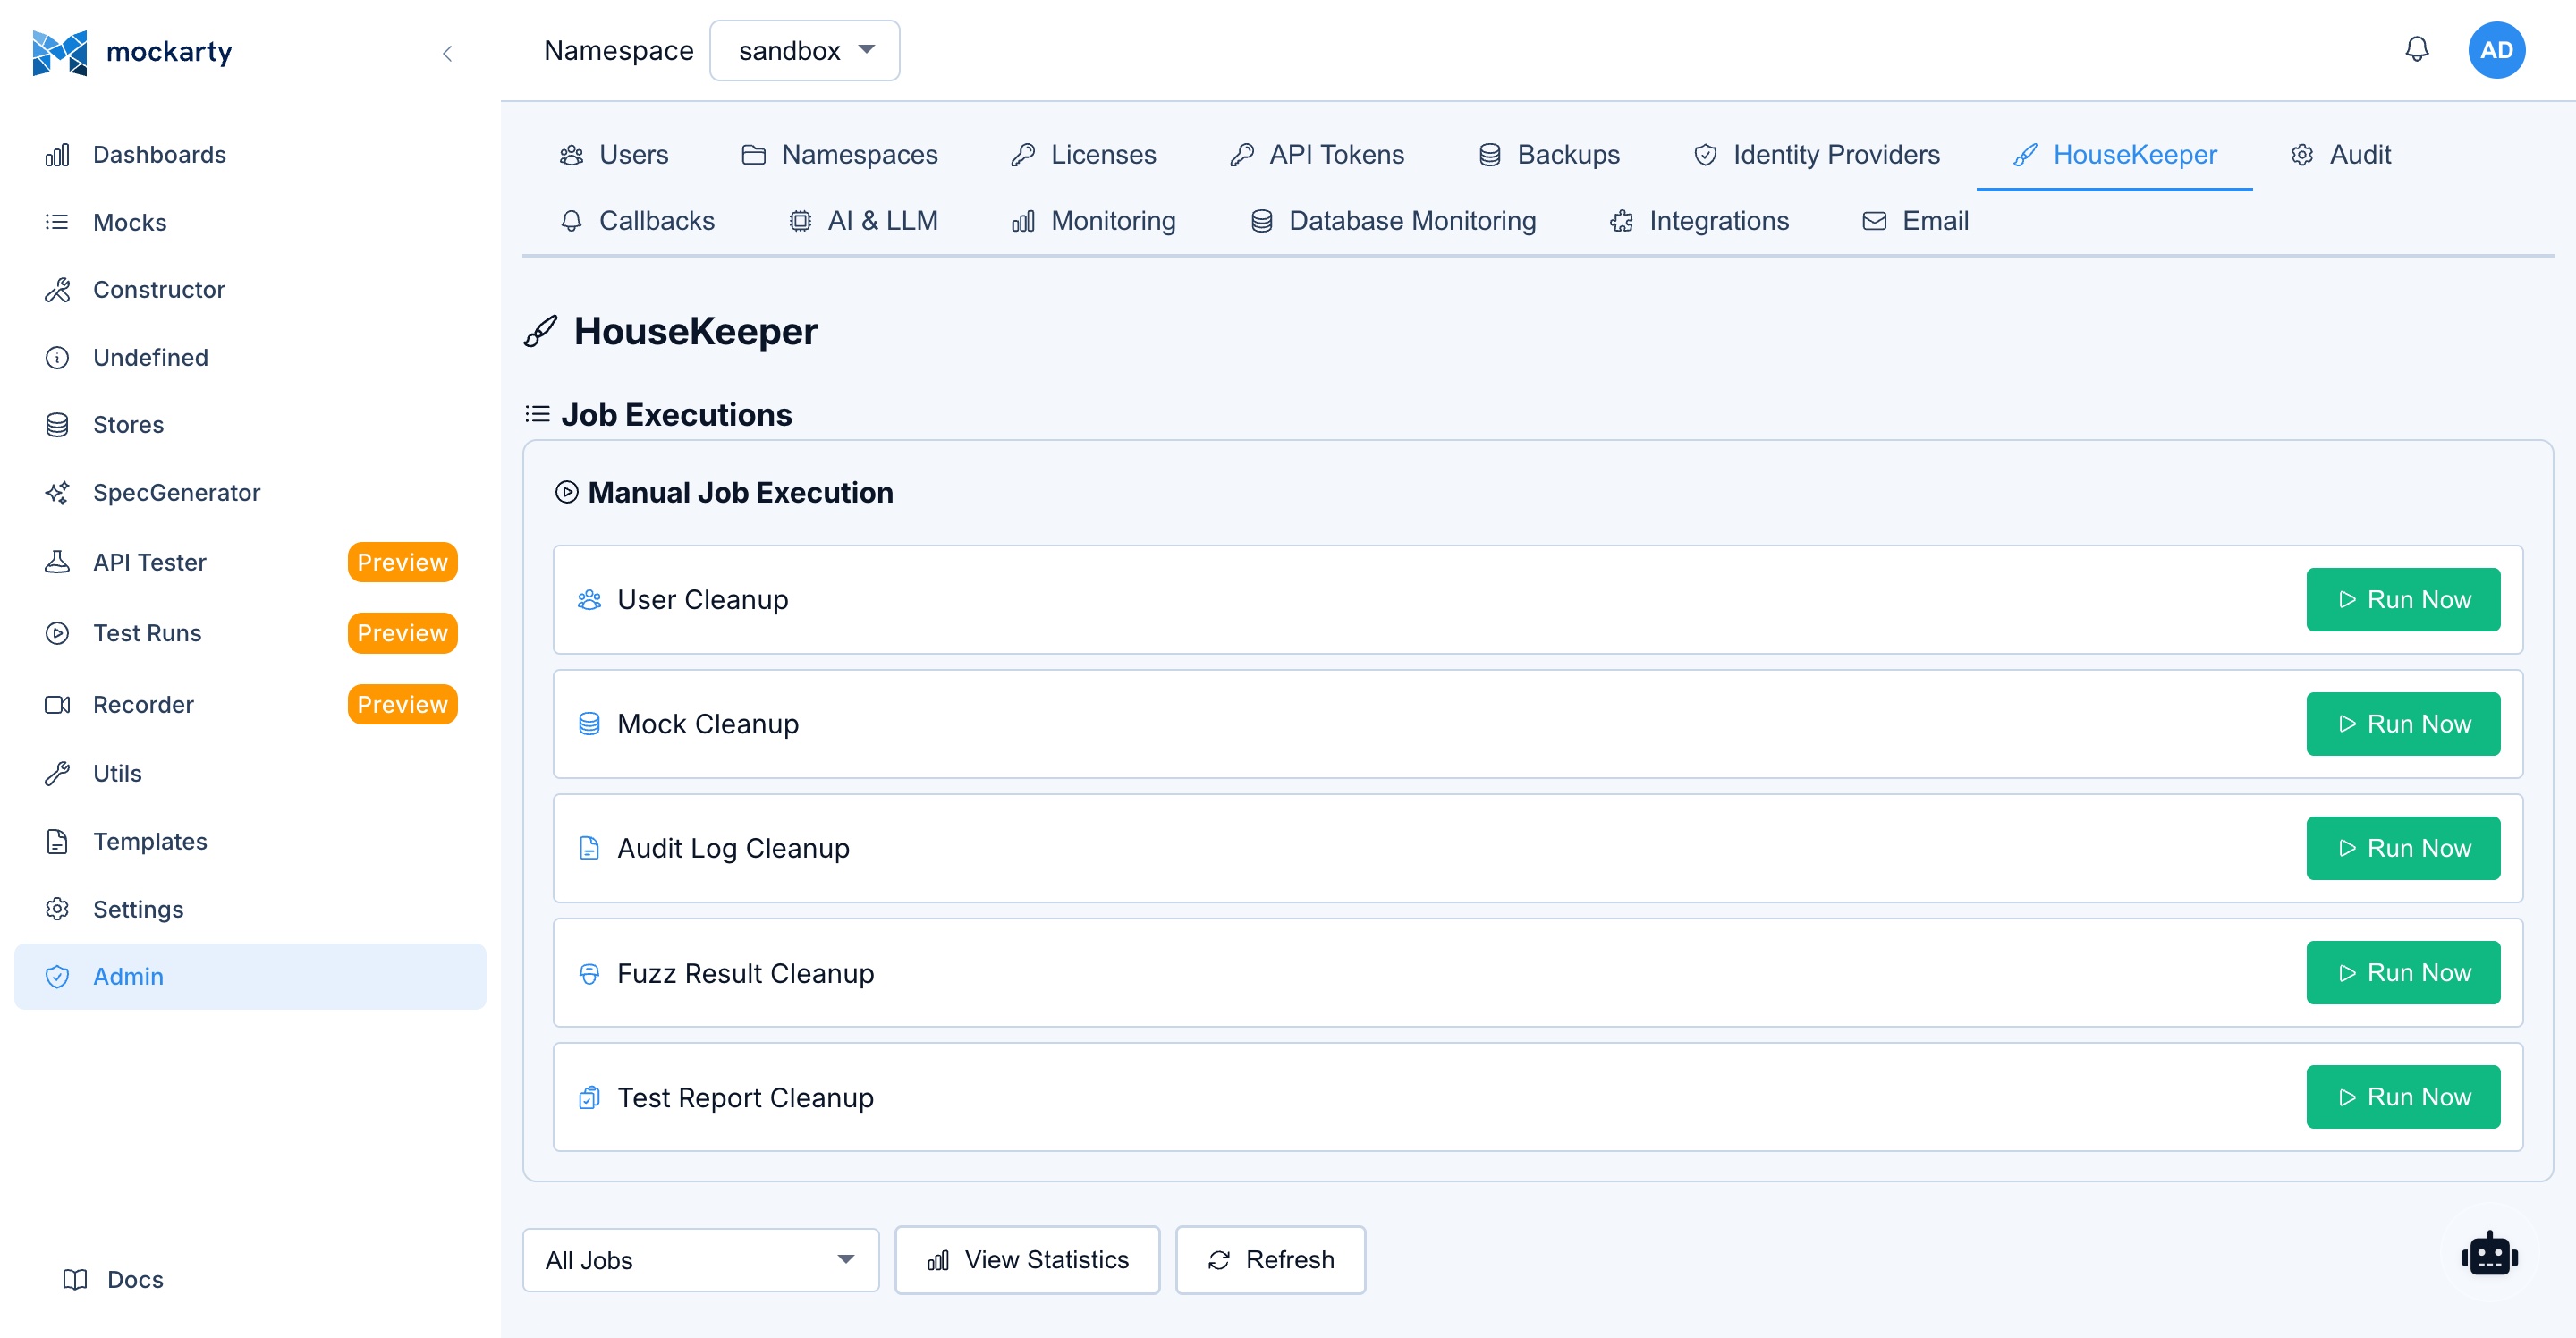
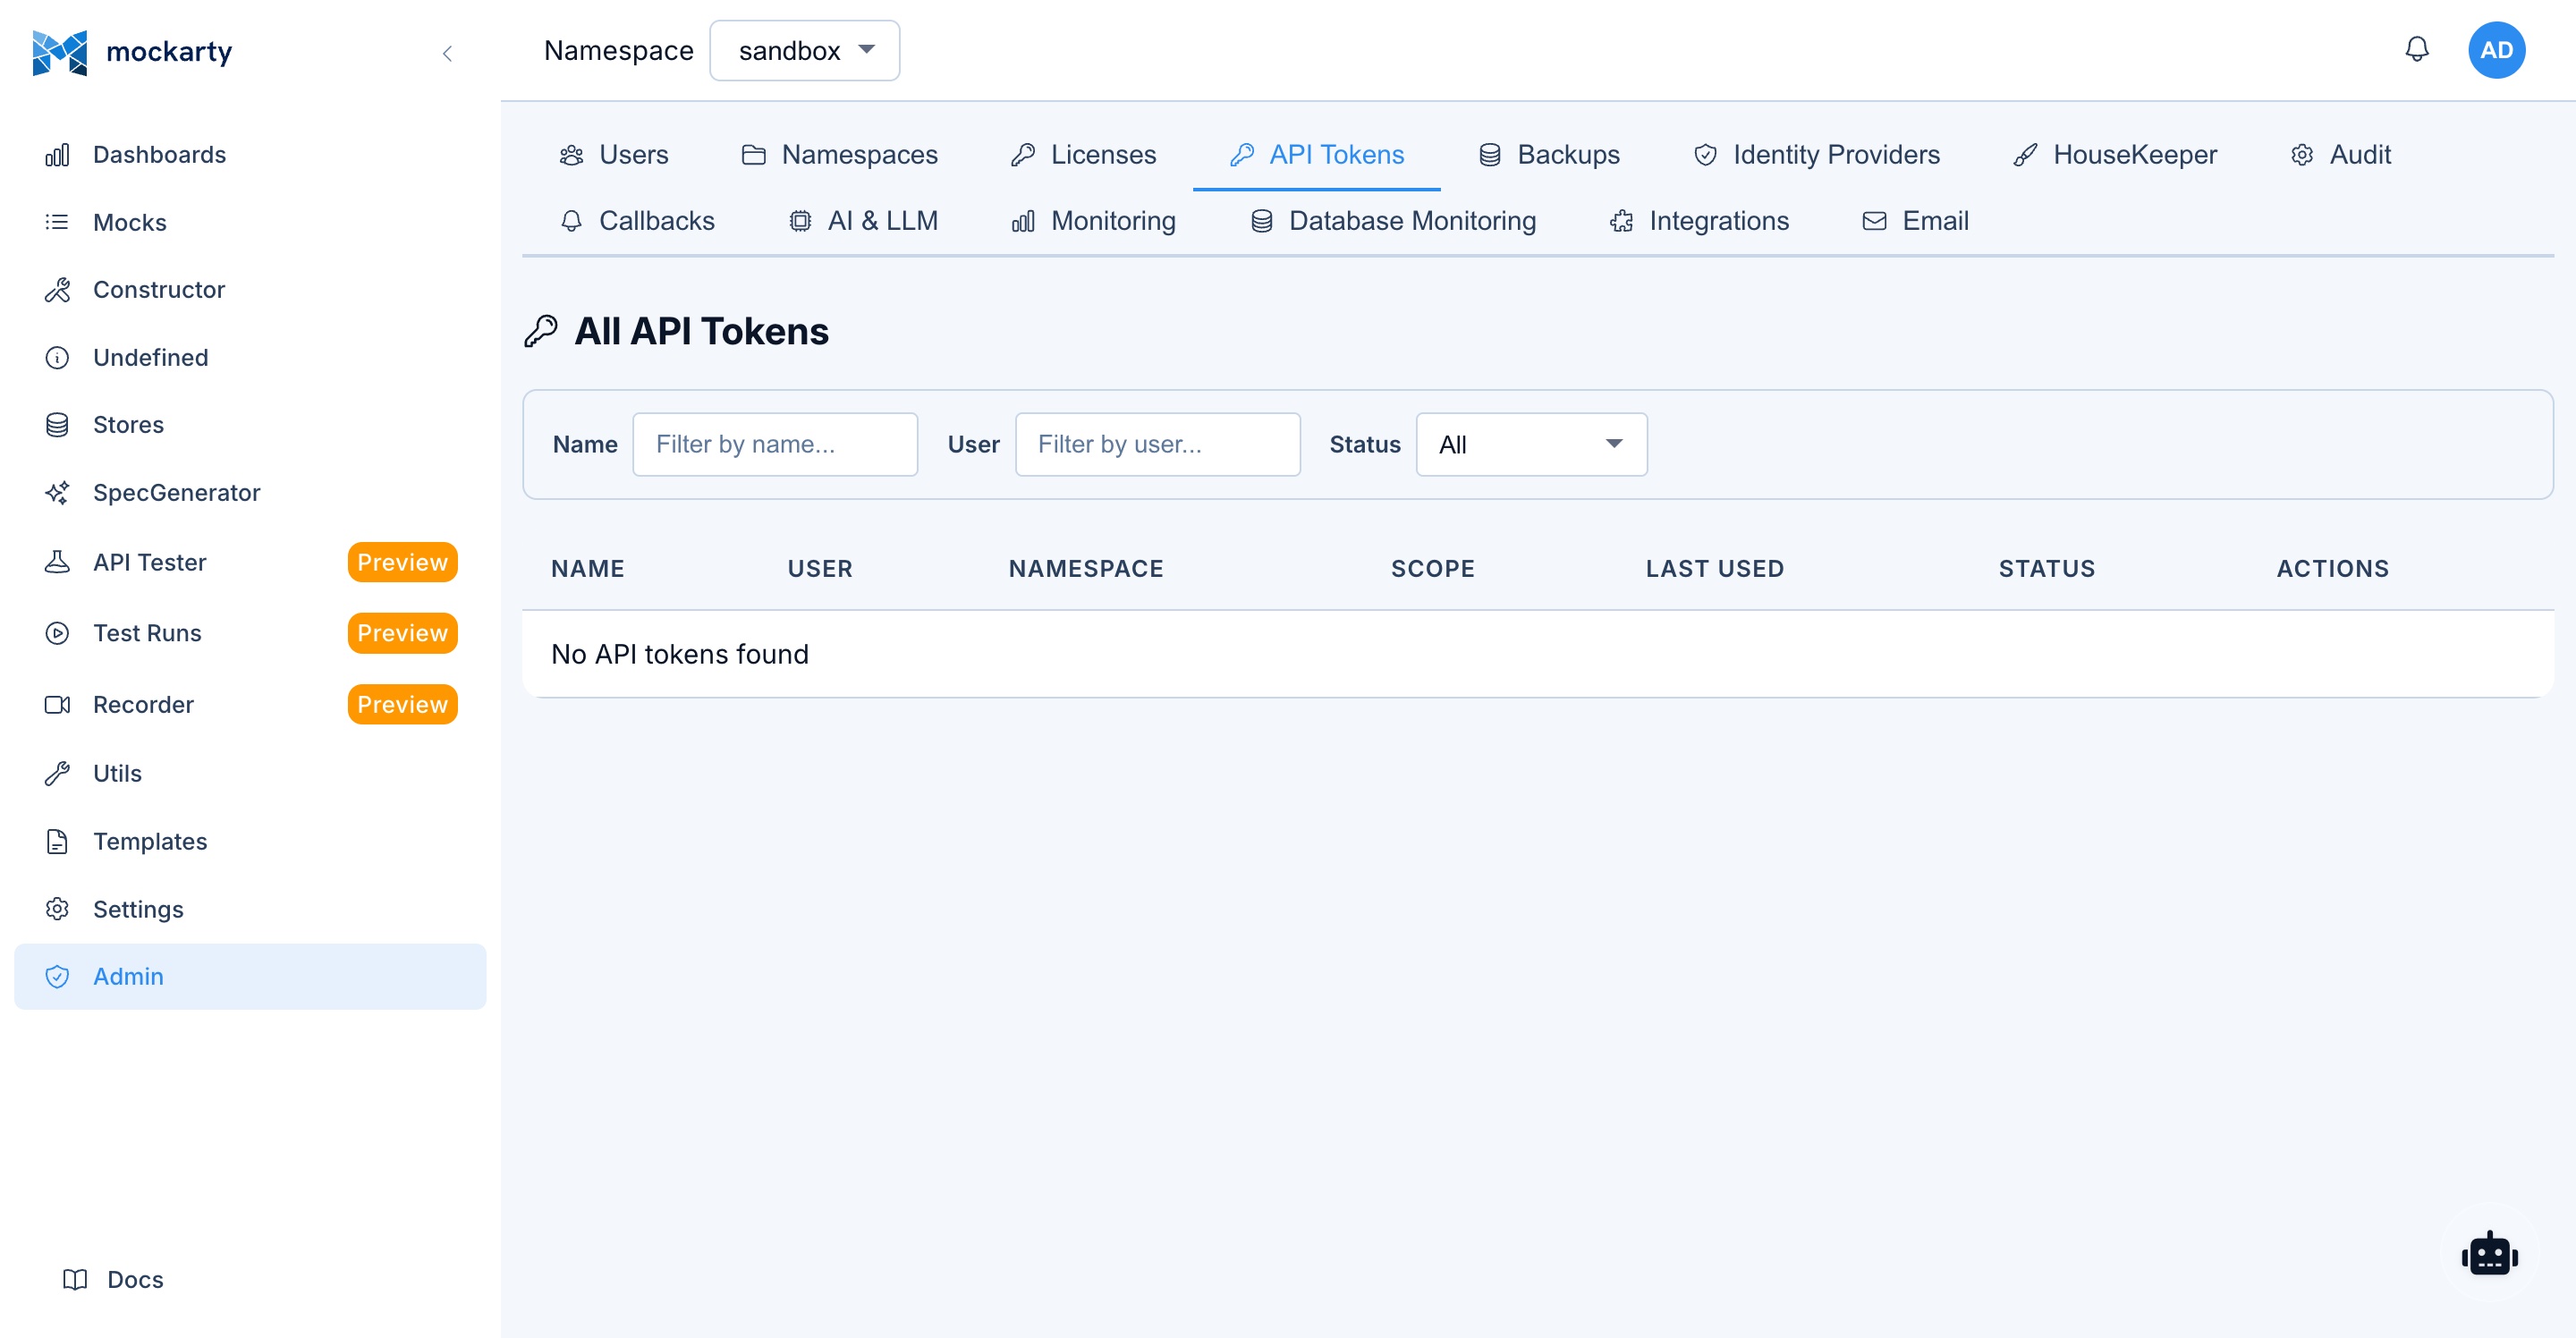
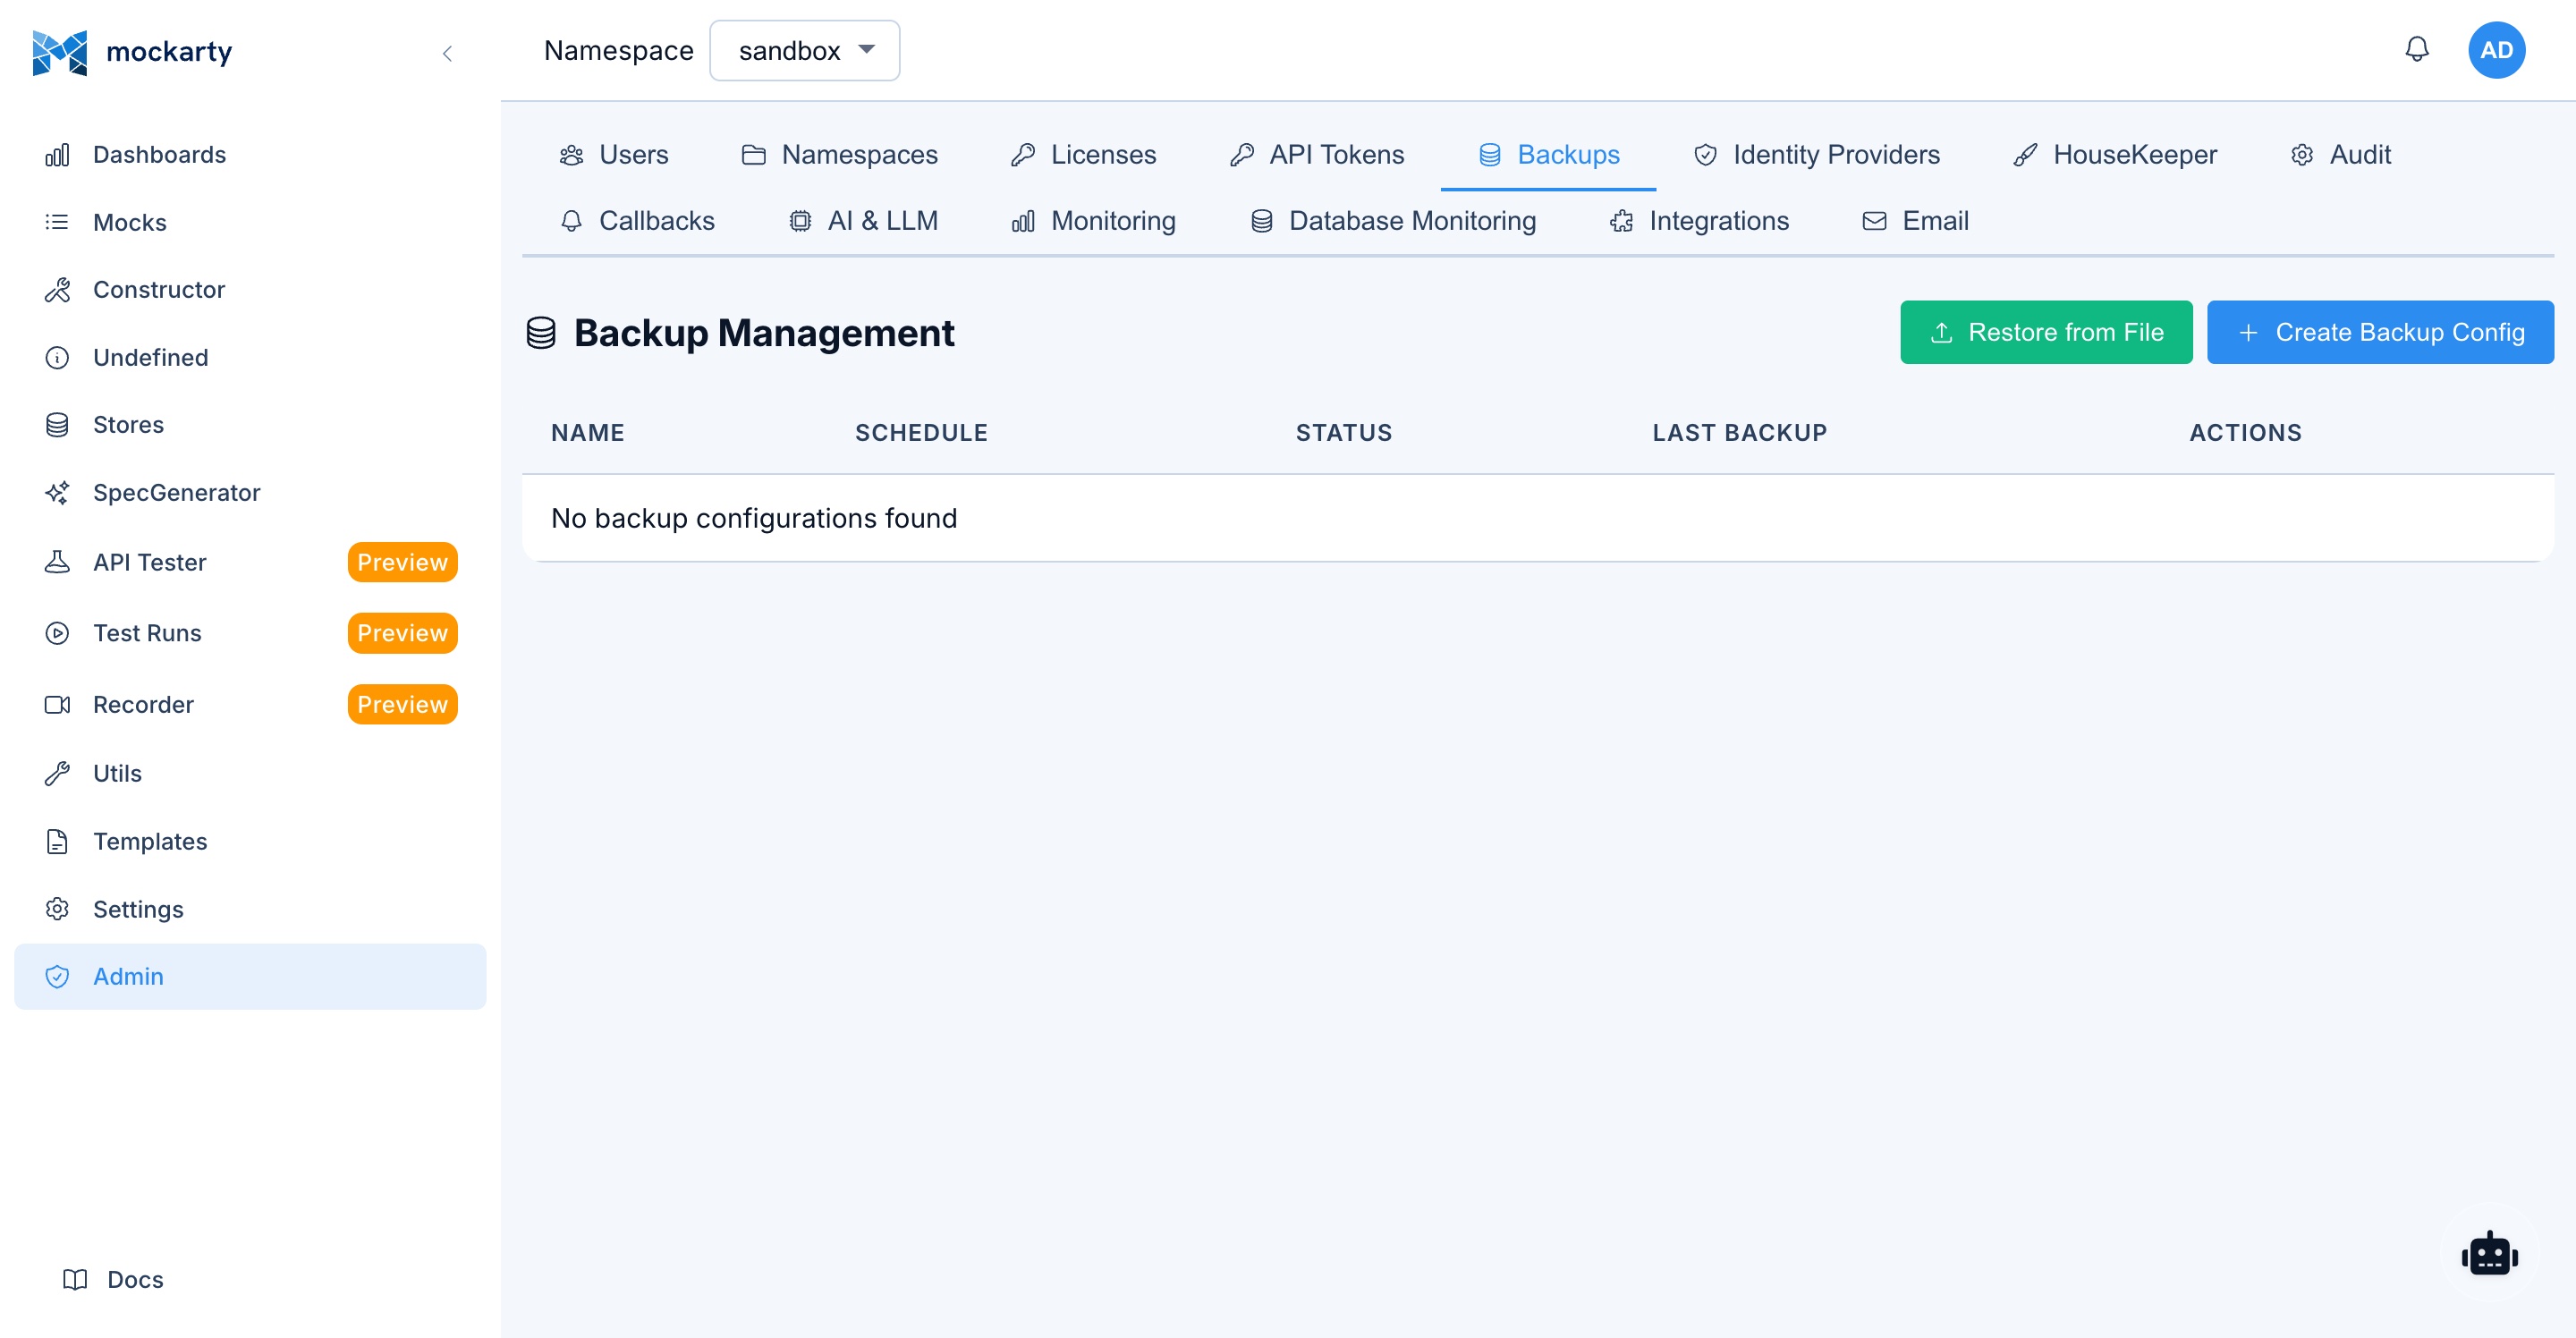
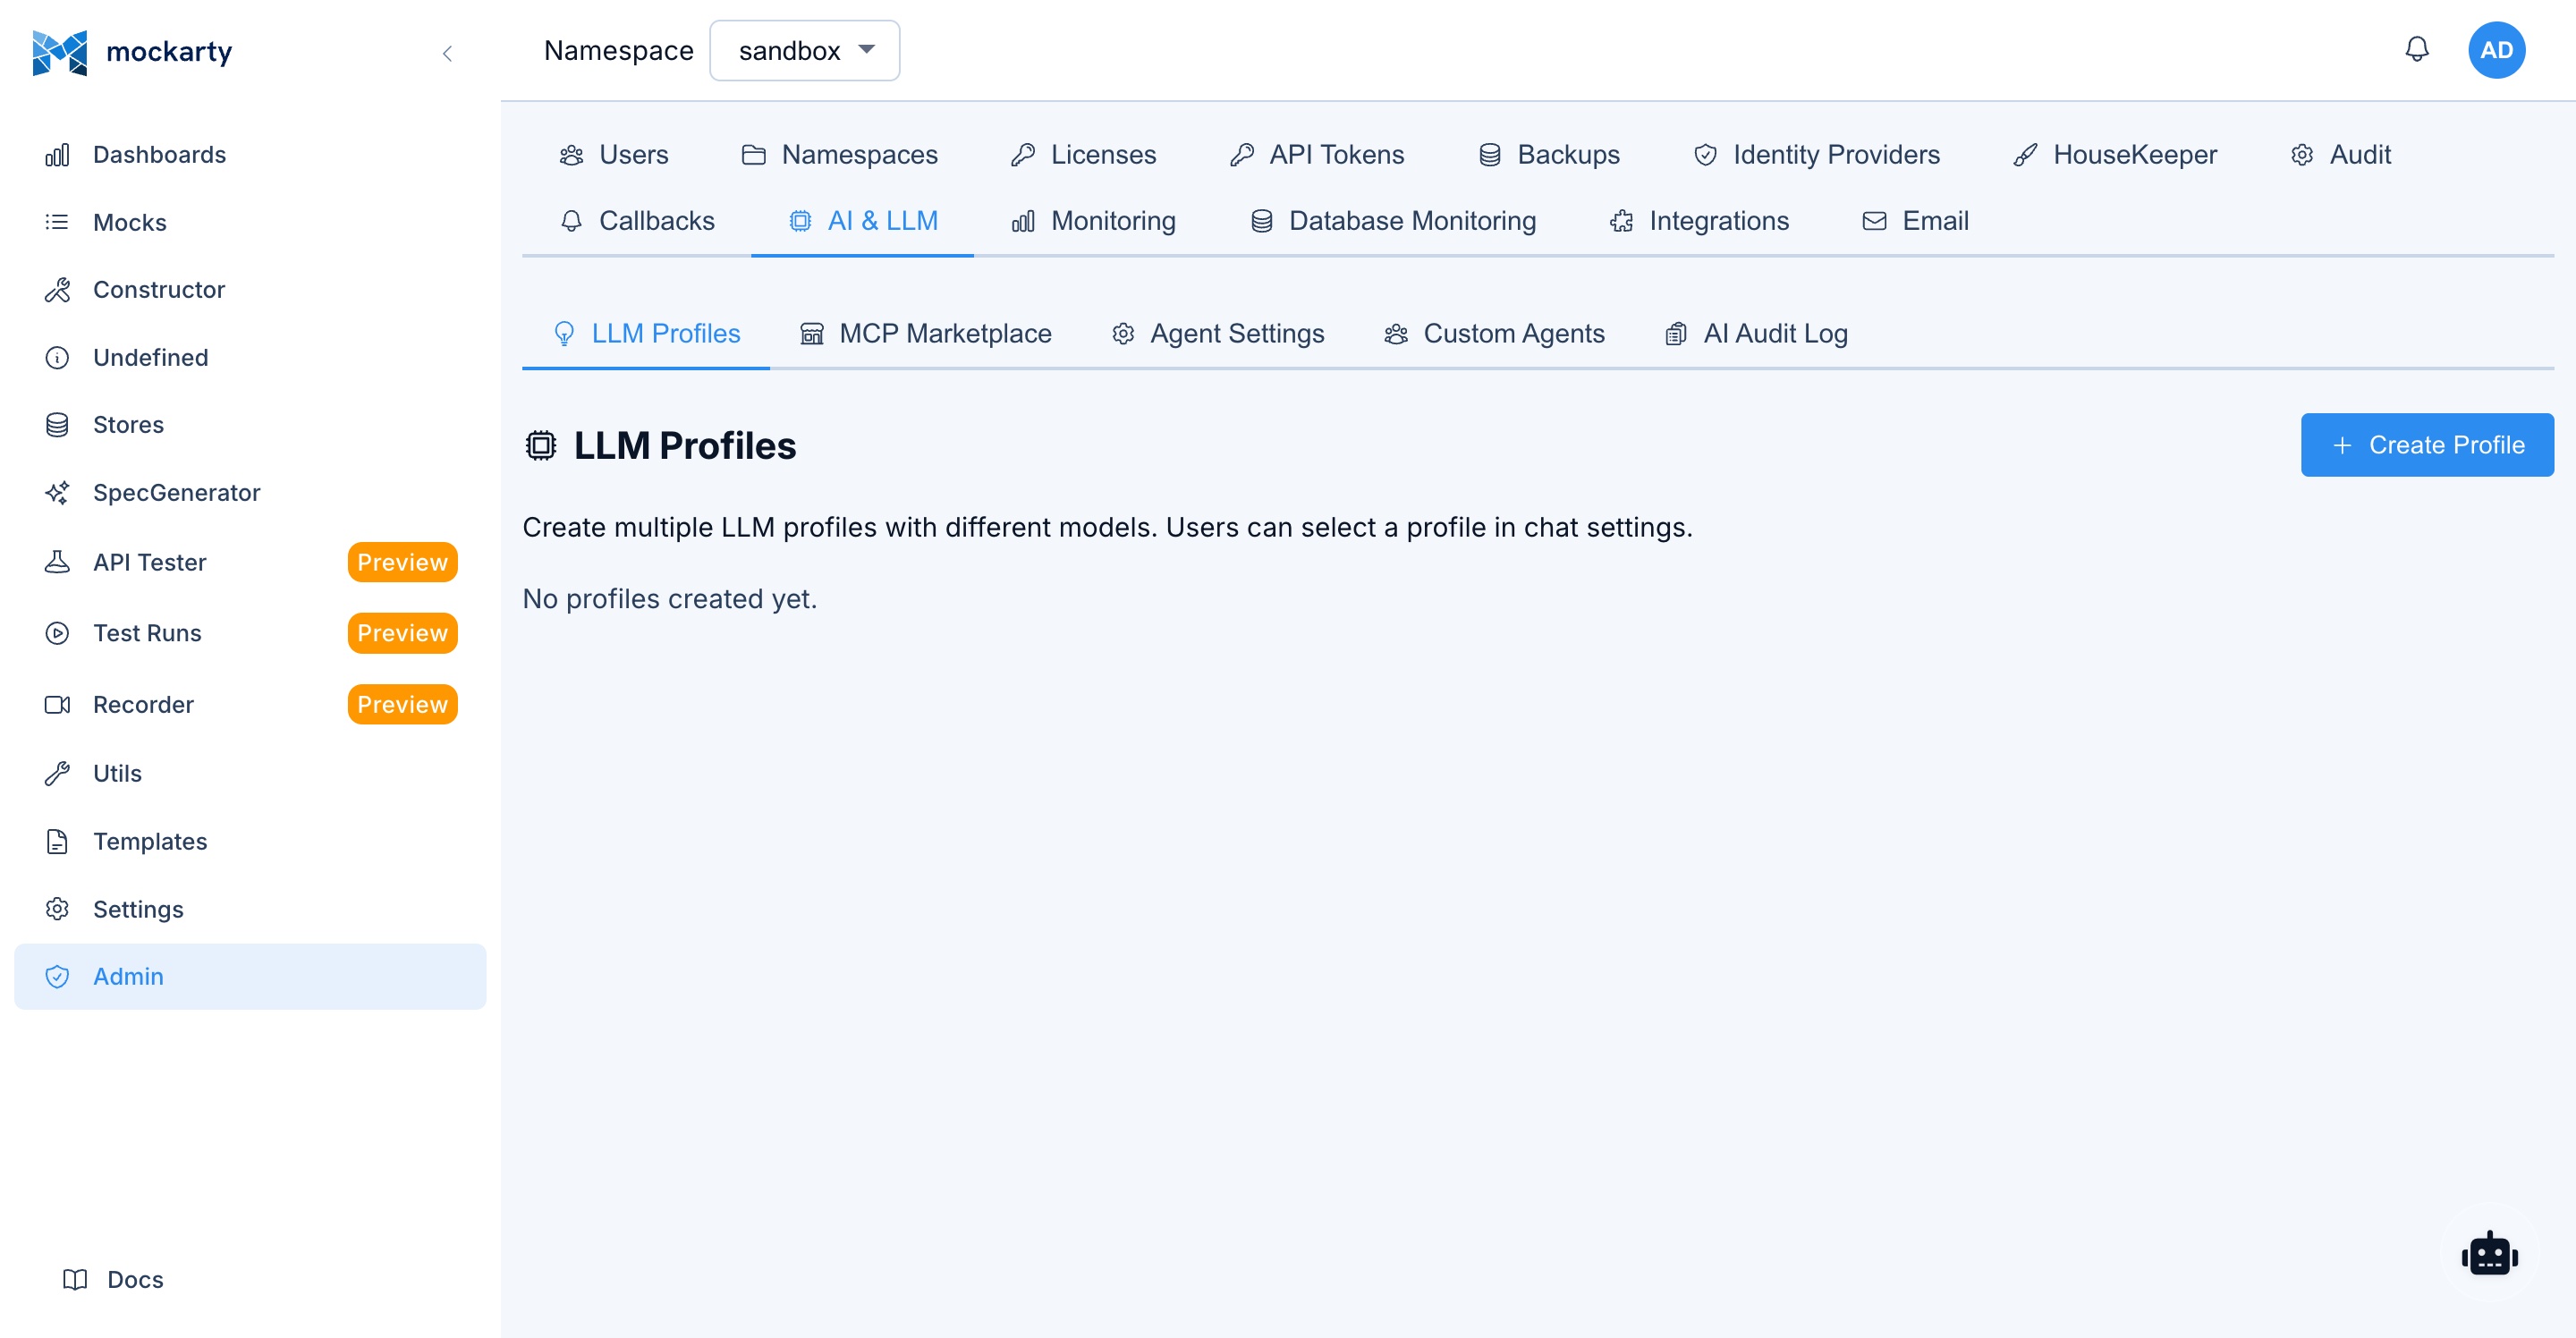
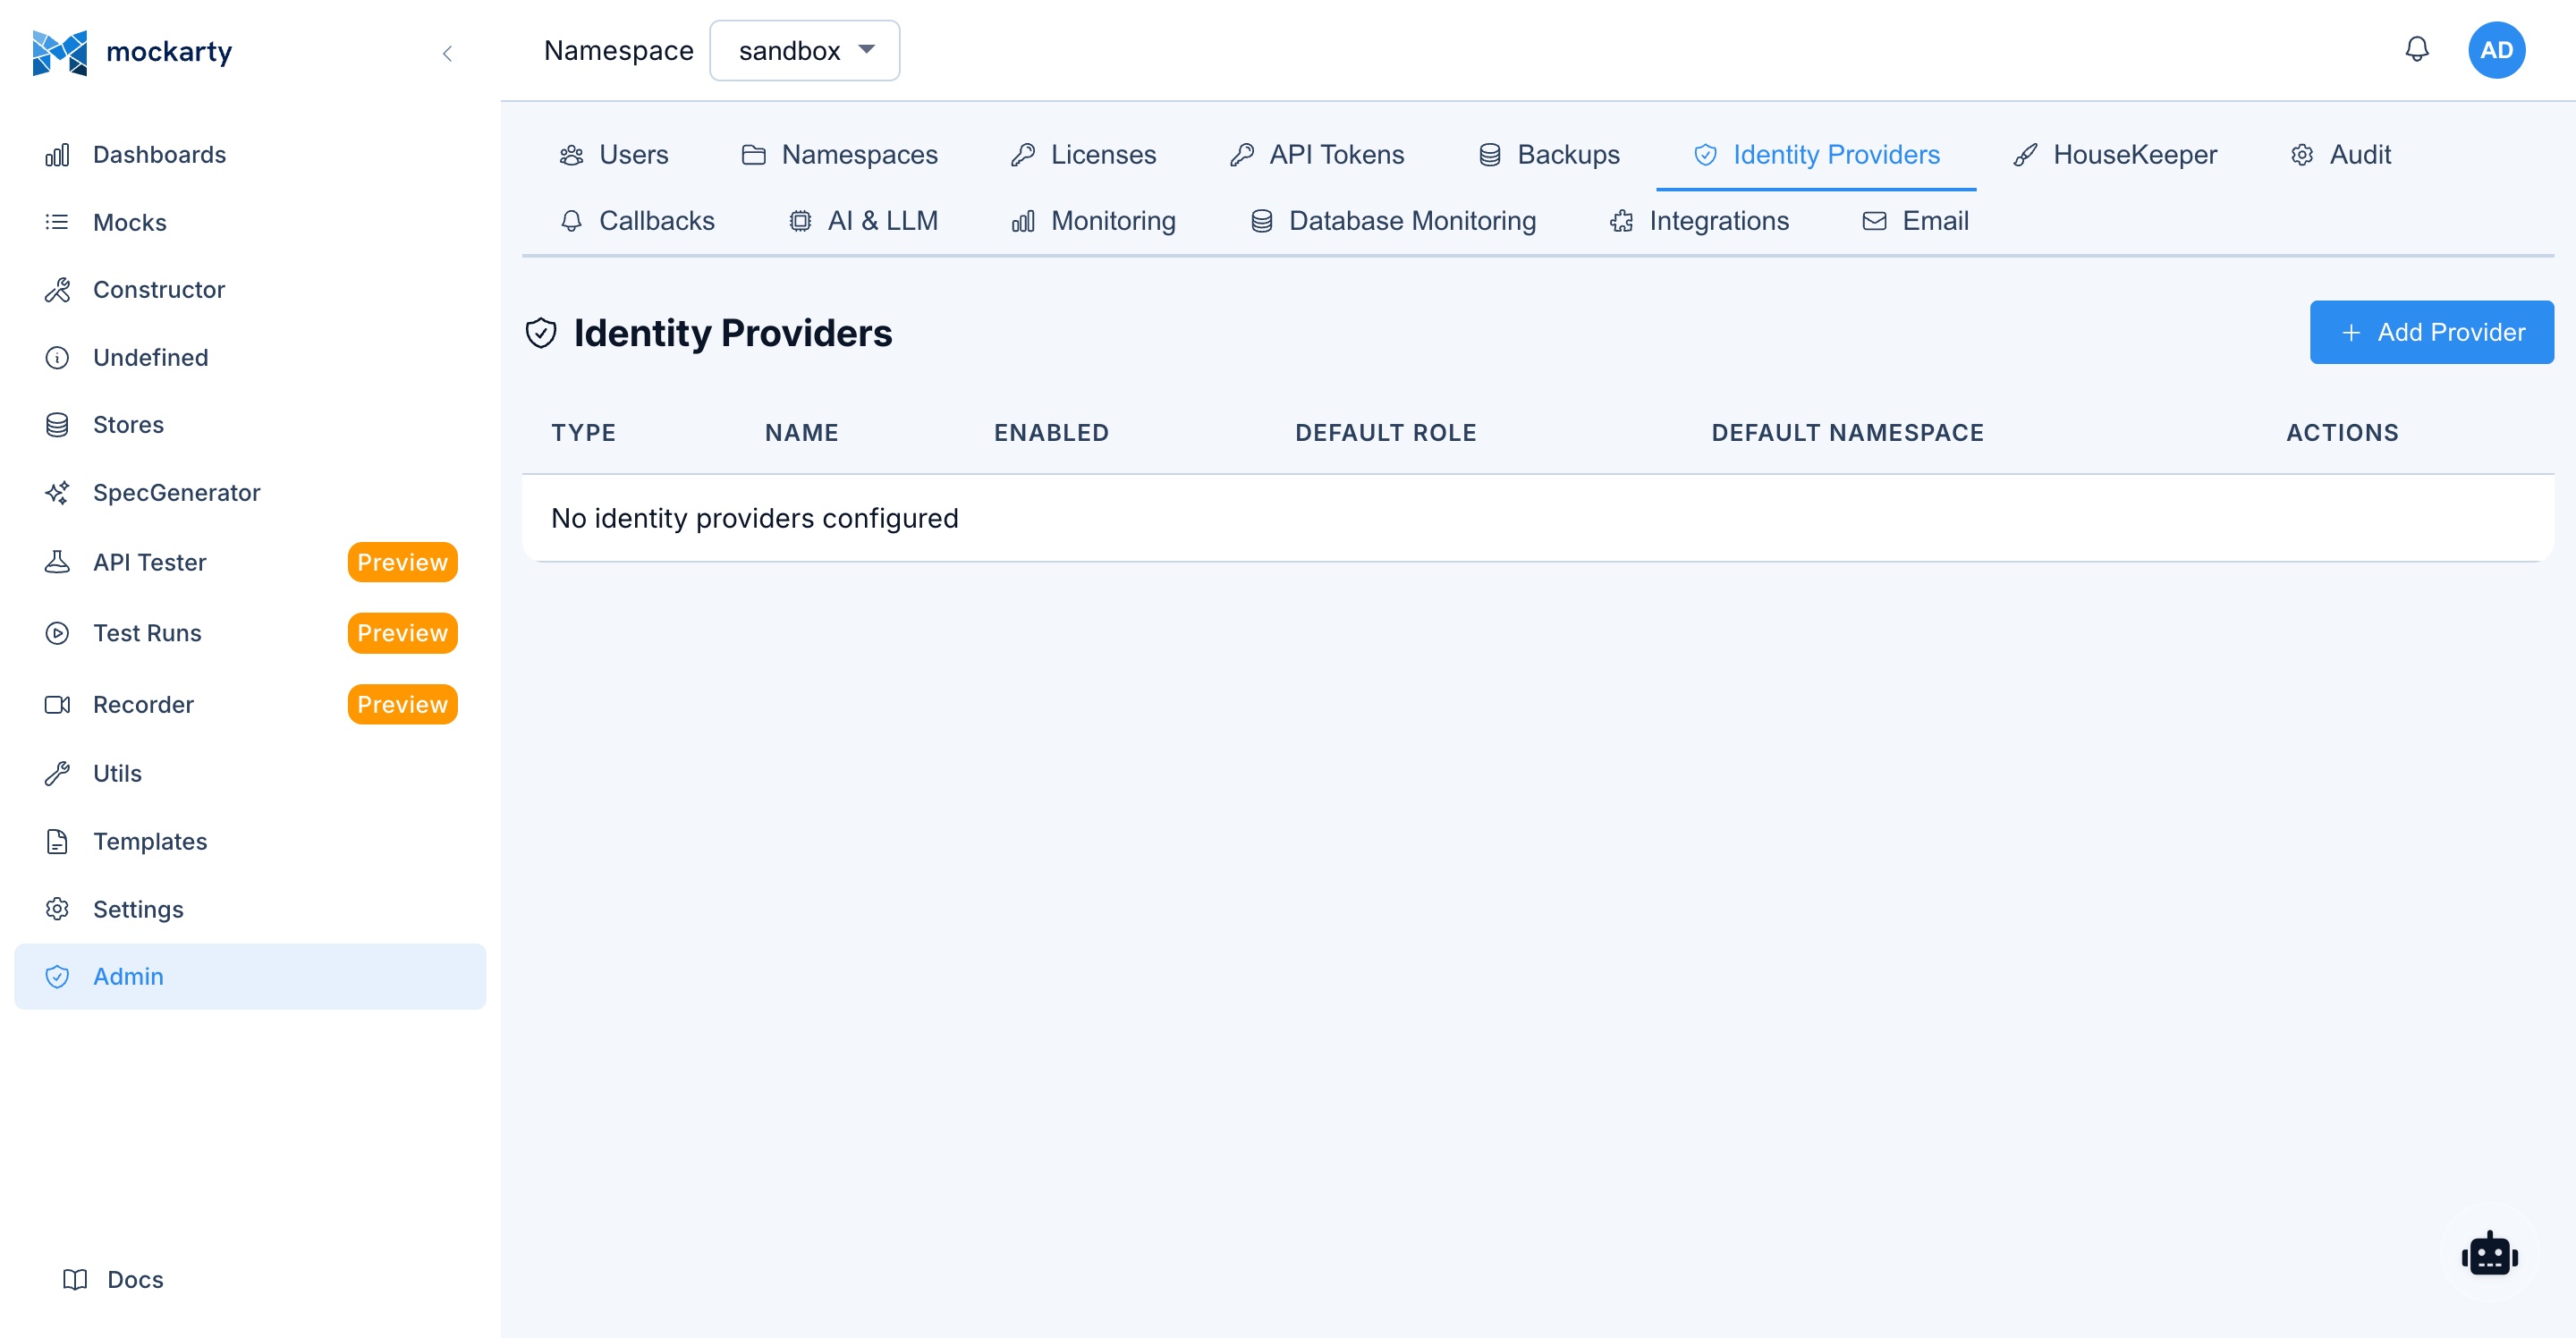
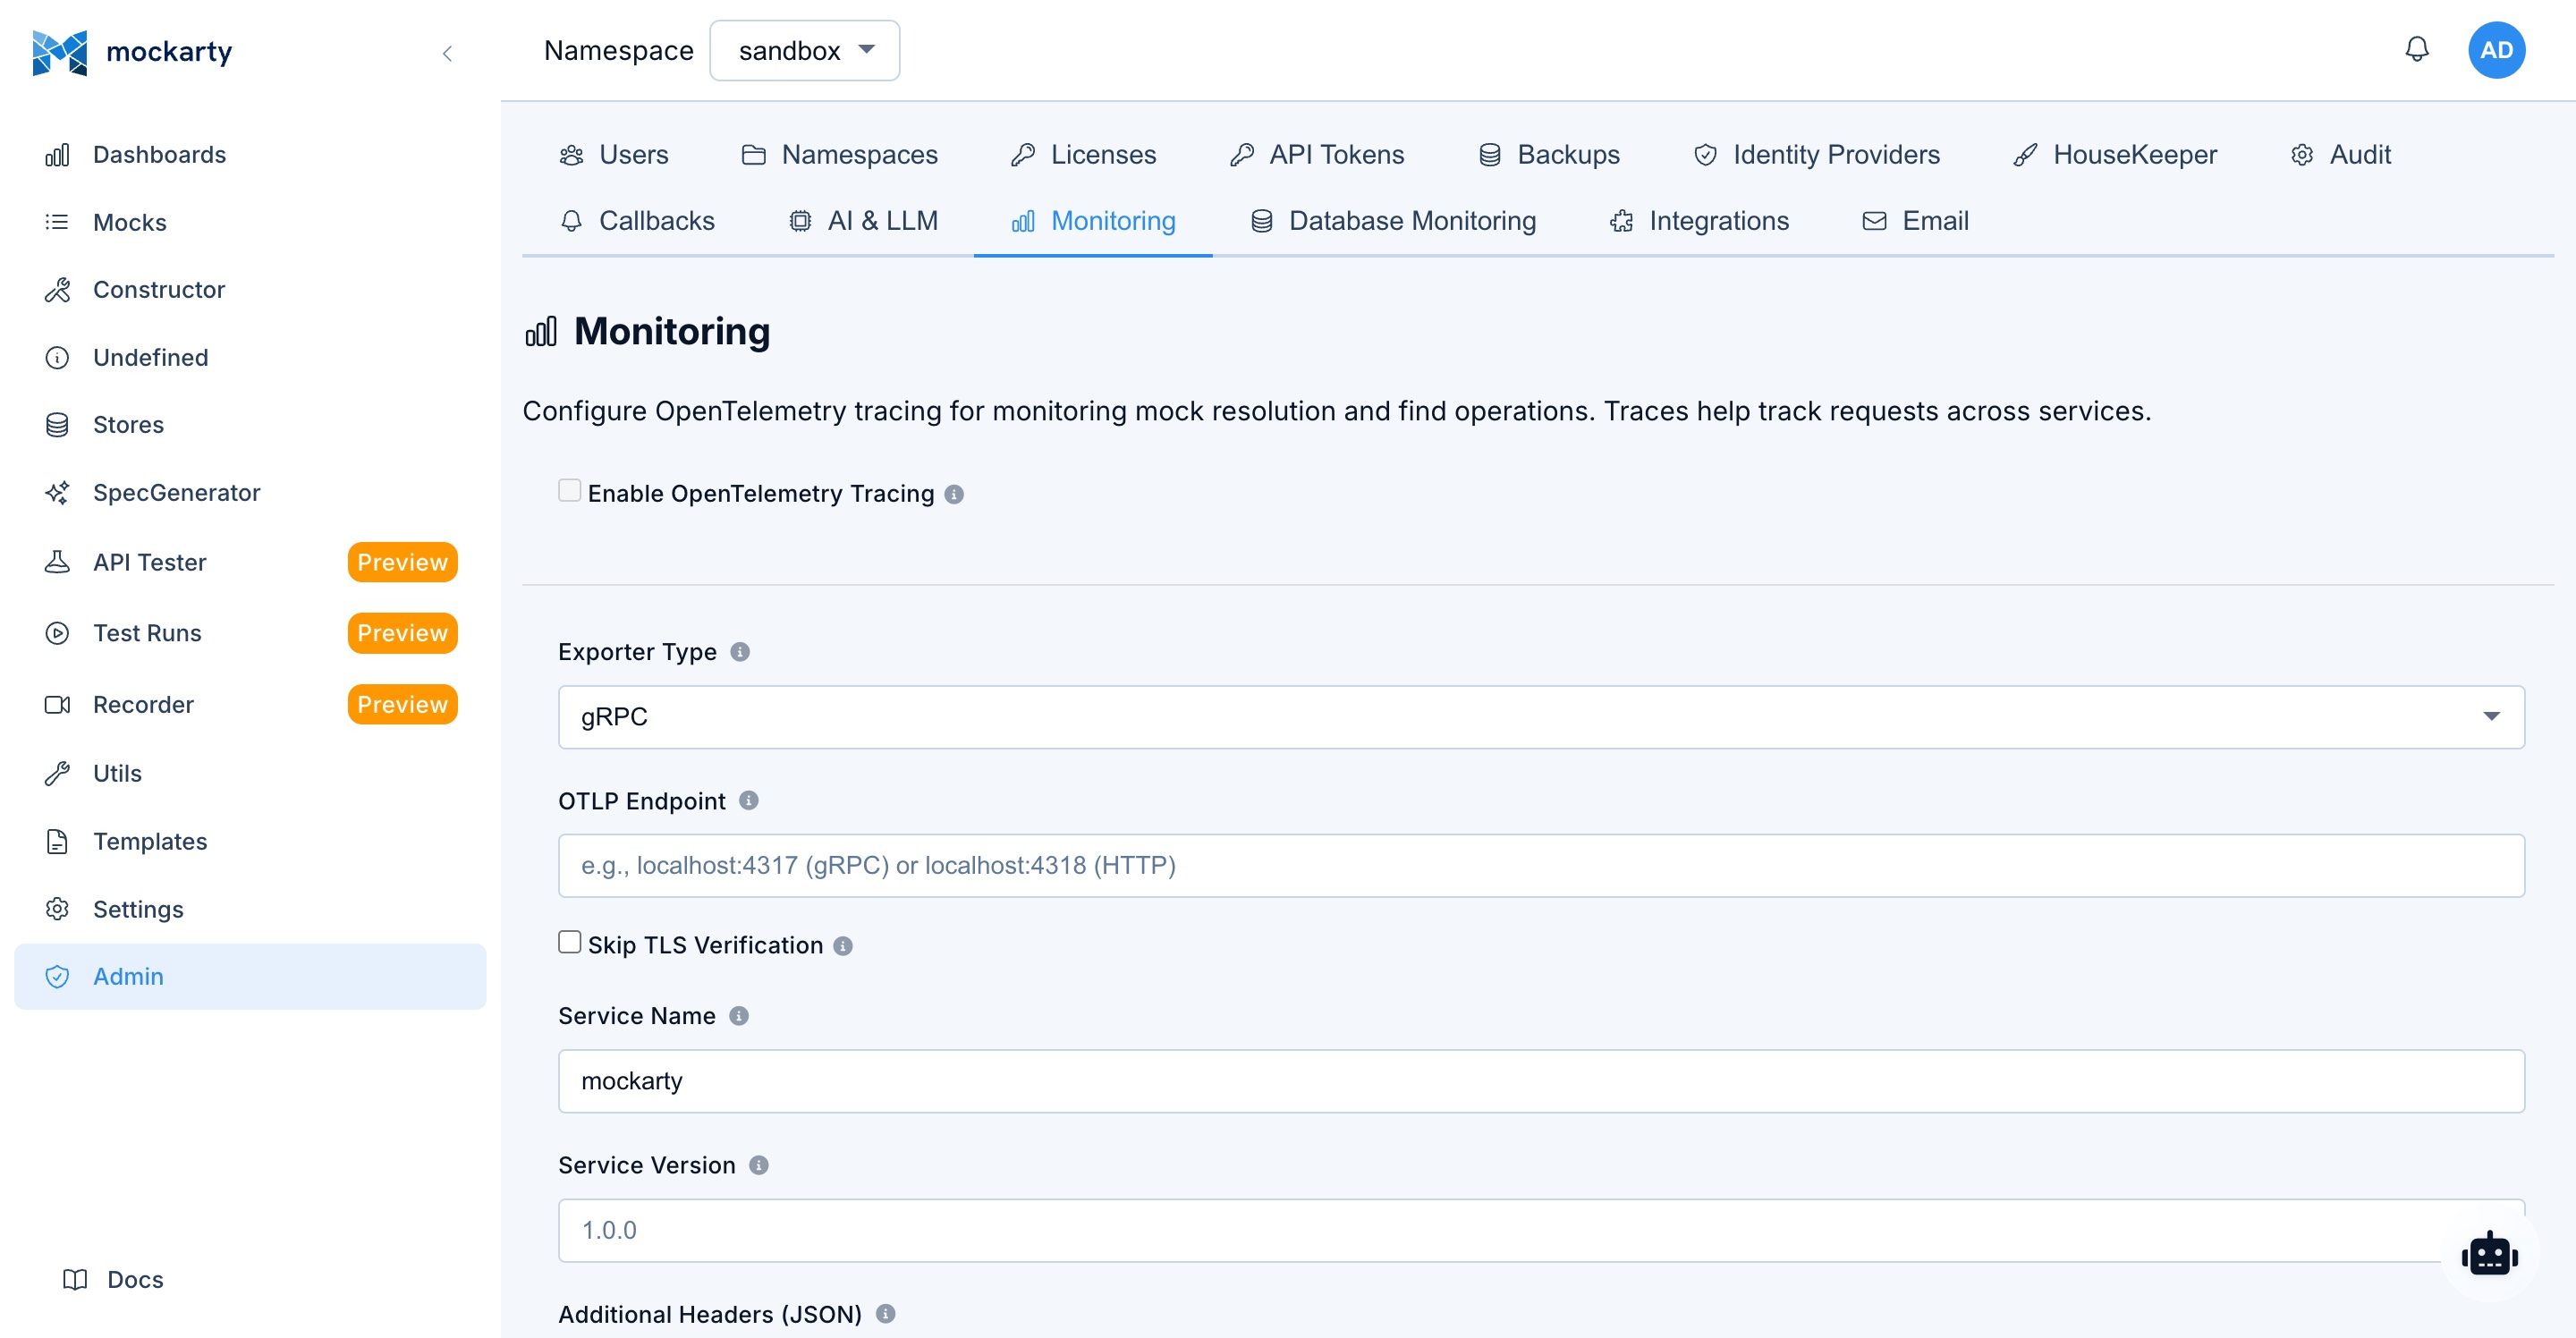
User Management
Comprehensive user administration:
- Create user: Add new user accounts with username, email, and initial password.
- Edit user: Update user profile information, email, and display name.
- Set password: Reset a user’s password (generates a temporary password or sends a reset link).
- Disable / Enable: Temporarily disable a user account without deleting it. Disabled users cannot log in.
- Delete user: Permanently remove a user account and all associated data.
- System roles: Assign system-wide roles to users:
| Role | Permissions |
|---|---|
| Admin | Full system access. Can manage all users, namespaces, and system settings. |
| Support | Elevated access. Can manage users, namespaces, cleanup settings, LLM profiles, webhooks, and database health within their scope. Cannot change system-wide settings or perform destructive administrative actions. |
| Auditor | Read-only access to audit logs and system metrics. Cannot modify any resources. |
| User | Standard user. Access is determined by namespace role assignments. |
Namespace Management
System-wide namespace administration:
- View all namespaces: See all namespaces across the system with member counts and resource statistics.
- Create namespace: Create a new namespace and assign an initial owner.
- Delete namespace: Soft-delete a namespace and all its resources. Deleted namespaces can be restored within the retention period.
- Restore namespace: Recover a previously deleted namespace with all its resources.
Cleanup Settings
Configure global cleanup policies that apply to all namespaces:
- Log retention: Default retention period for mock request logs.
- Undefined request retention: Default retention period for unmatched requests.
- Test report retention: Default retention period for test run results.
- Cleanup schedule: Configure when cleanup jobs run (cron expression).
These settings serve as defaults; individual namespaces can override them with shorter retention periods.
Audit Logs
View and export the system audit trail:
- Event types: User logins, mock CRUD operations, namespace changes, admin actions, API token usage.
- Filters: Filter by user, event type, date range, and namespace.
- Export: Download audit logs as CSV or JSON for compliance and reporting.
- Retention: Audit logs are retained independently from other cleanup policies.
Job Executions
View the history of scheduled background jobs:
- Job types: Cleanup, backup, scheduled tests, health checks.
- Status: Completed, failed, running, or queued.
- Details: Execution time, duration, and any error messages.
- Manual trigger: Run a job manually outside its schedule.
Database Health
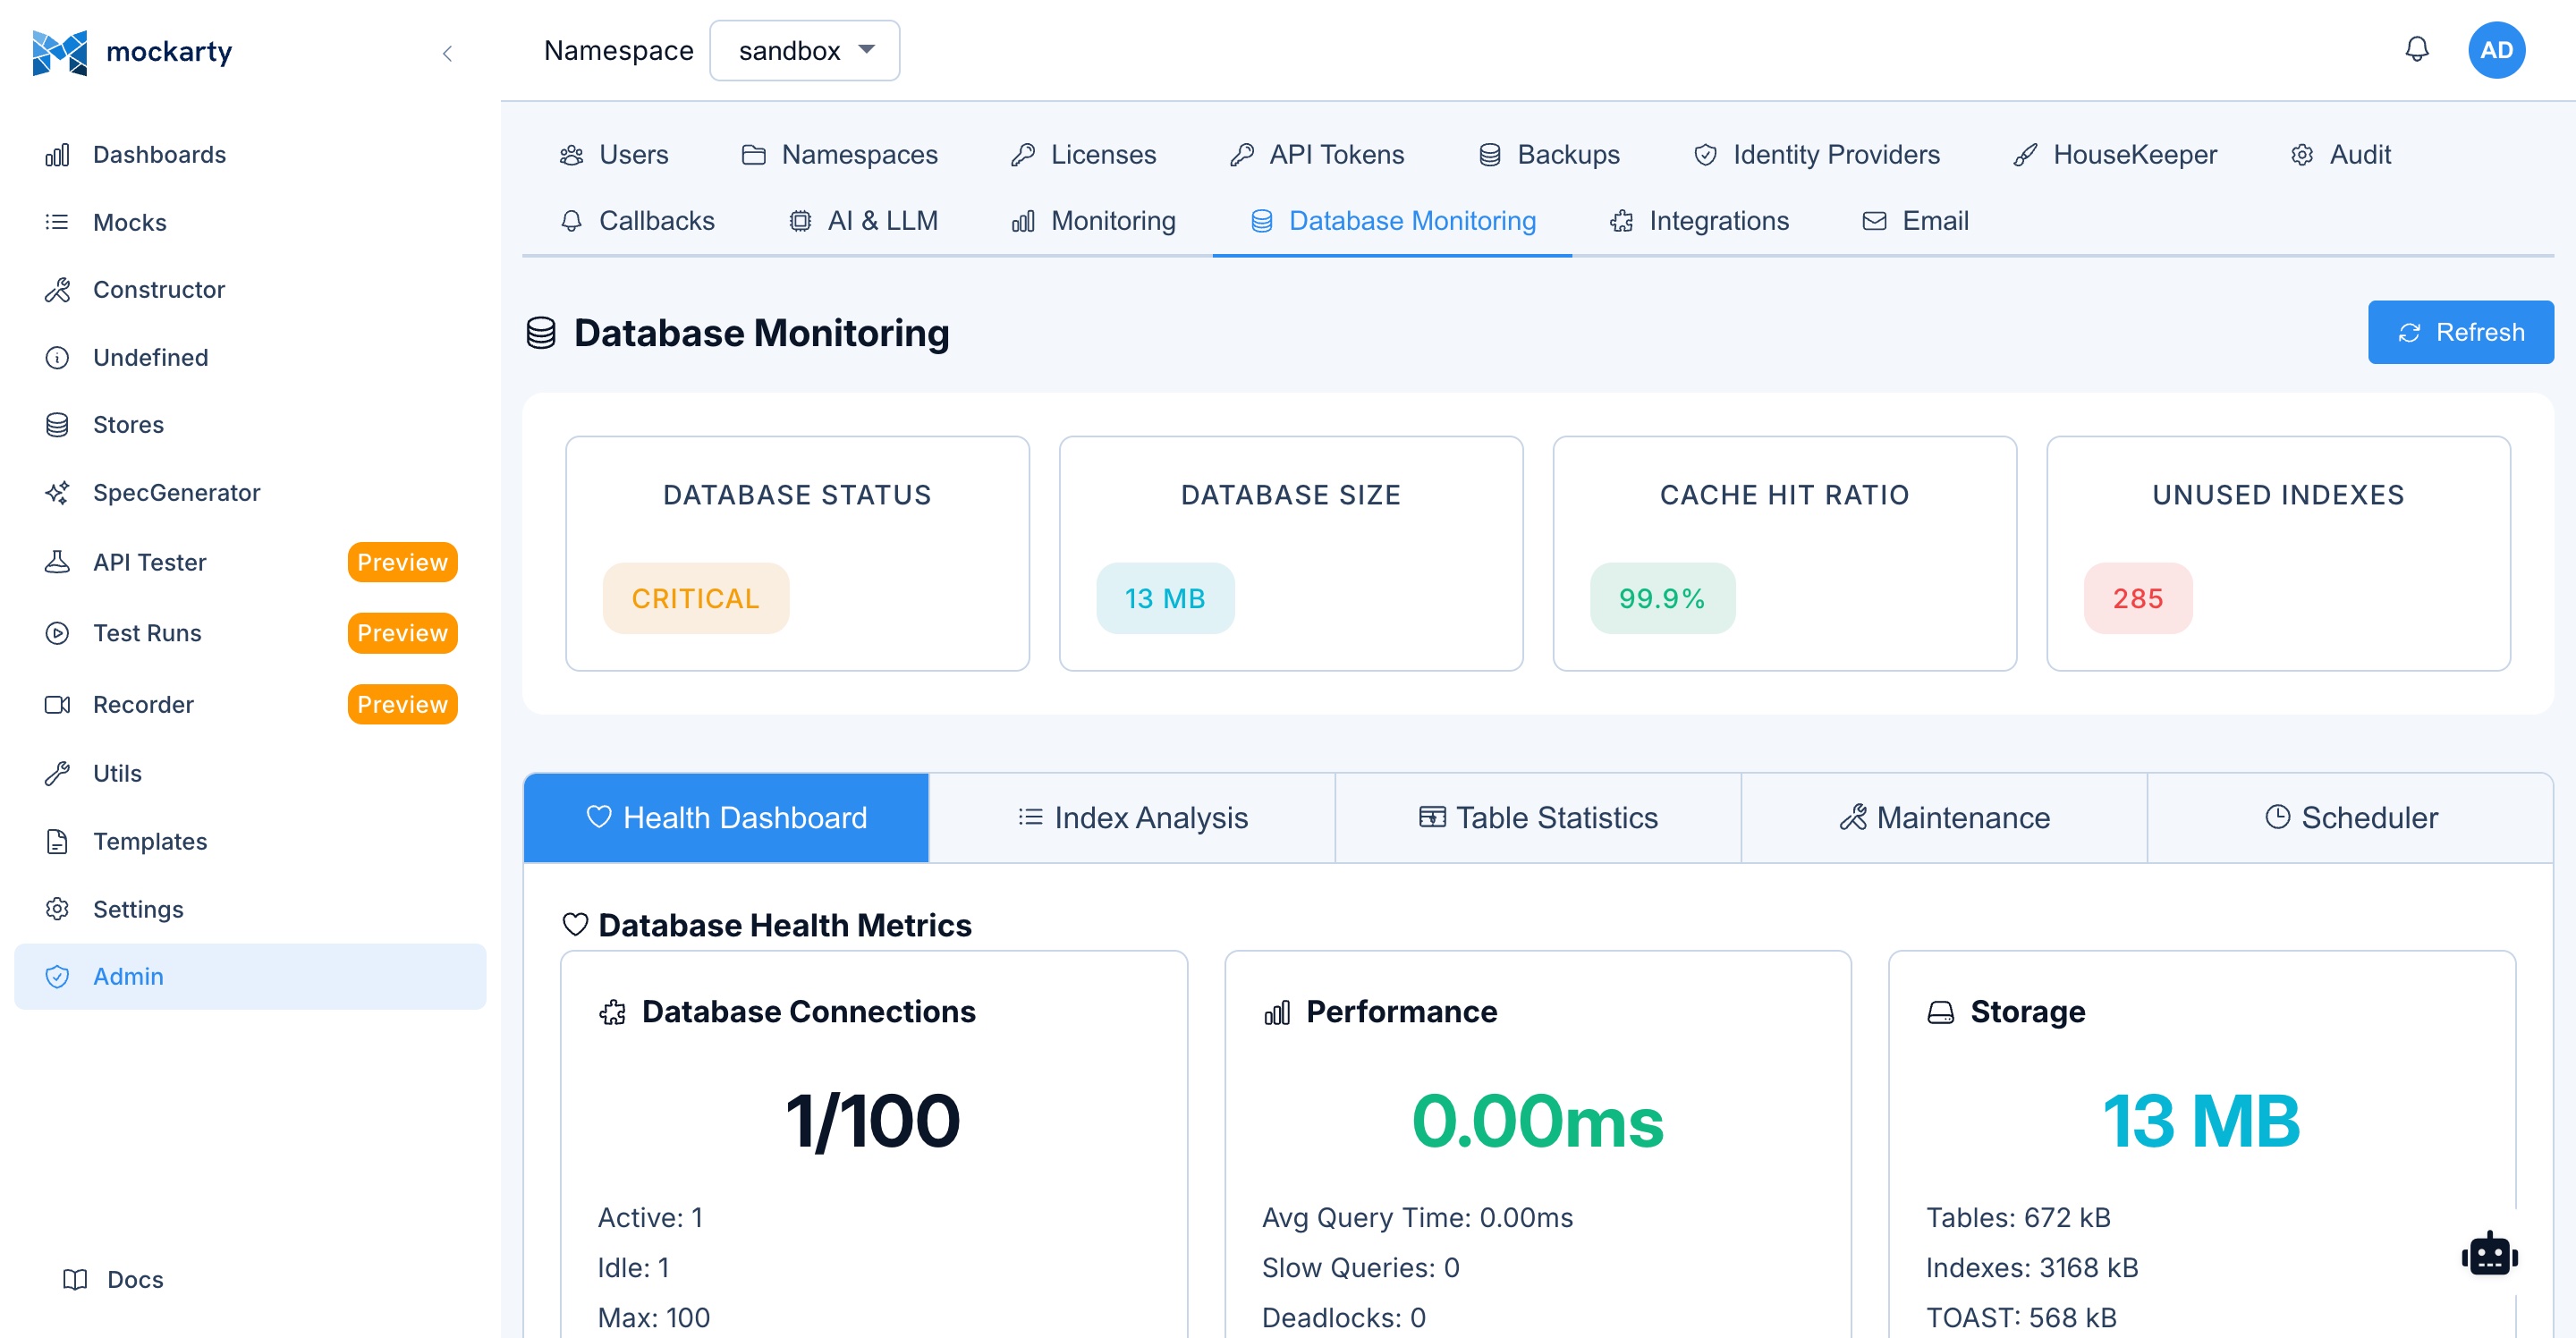
Monitor and maintain database health:
- Index status: View all database indexes with their size, usage statistics, and health.
- Table statistics: Row counts, table sizes, dead tuple counts, and last vacuum/analyze times.
- Maintenance recommendations: Suggestions for index optimization, vacuuming, and other maintenance tasks.
- Connection pool: Current connection pool usage and configuration.
Email Configuration
Configure email notifications (requires EMAIL_ENABLED=true):
- SMTP settings: Host, port, username, password, and TLS configuration.
- Sender address: The “From” address for all outgoing emails.
- Test email: Send a test email to verify the SMTP configuration.
- Email templates: Customize the HTML templates used for notification emails (password reset, 2FA codes, invitations, test run notifications).
LLM Profiles
Configure global AI model profiles:
- Provider settings: API endpoints, keys, and model identifiers for supported LLM providers.
- Default model: Set the default model used when namespaces do not specify their own.
- Usage tracking: View token usage and cost estimates per namespace.
- Rate limits: Configure per-namespace rate limits for LLM API calls.
Monitoring (OpenTelemetry)
Configure OpenTelemetry tracing for mock resolution and find operations:
- Enable OpenTelemetry Tracing: Turn tracing on or off. Changes apply on the fly — no restart required.
- Exporter Type: OTLP over gRPC or HTTP.
- OTLP Endpoint: The collector address, e.g.
localhost:4317(gRPC) orlocalhost:4318(HTTP). - Skip TLS Verification: Use a plaintext/insecure connection to the collector.
- Service Name / Service Version: Identify this Mockarty instance in your tracing backend.
- Additional Headers (JSON): Extra headers sent to the collector (e.g. an authorization token).
Integrations (Admin)
System-wide integration token management:
- View all integration tokens across all namespaces.
- Create tokens for system-level integrations (shared runners, orchestrators).
- Monitor token usage and last-active timestamps.
- Revoke tokens across the entire system.
Support Panel
Path: /ui/support
The Support Panel is available to users who have been assigned the Support system role. Support users have full read access and can manage users, namespaces, cleanup settings, LLM profiles, webhooks, and database health within their scope.
What is the Support Role?
The Support role is designed for team leads, QA leads, or designated support personnel who need visibility into the system to assist other users without having full administrator access. Support users can see more of the system than regular users but are restricted from making configuration changes that could affect the entire platform.
Support Capabilities
Users with the Support role can:
- View users and their profiles: Browse the list of all users in the system, see their assigned namespaces and roles. Useful for verifying account status when a user reports an issue.
- Reset user passwords: Help users who are locked out of their accounts by resetting their passwords.
- View all namespaces: See every namespace in the system with its member list and resource counts. This helps when troubleshooting namespace-scoped issues reported by users.
- View system status: Access system health information, including database connectivity, background job status, and resource utilization.
- View audit logs: Read the audit trail to investigate what happened when a user reports unexpected behavior (e.g., mocks disappearing, settings changing).
- View job executions: See the history of background jobs (cleanup, backups, scheduled tests) to diagnose issues like missing test reports or stale data.
What Support Users Cannot Do
The Support role intentionally does not grant:
- Changing system-wide settings (telemetry, email configuration).
- Performing destructive administrative operations on system resources.
How to Assign the Support Role
Only administrators can assign the Support role:
- Navigate to Admin Panel (
/ui/admin). - Open the User Management section.
- Find the user you want to promote and click Edit.
- In the System Role dropdown, select Support.
- Save the changes. The user will see the Support navigation item in their sidebar on their next page load.
AI Features
Mockarty integrates AI across the platform with dedicated buttons on every major page. Each AI button follows a consistent pattern: click to run the operation, click the gear icon to customize settings.
AI Button Pattern
Every AI feature provides:
- Action button — click to run the AI operation
- Settings gear — select LLM profile, enter a custom prompt, and manage MCP tool integrations
- Result display — AI responses rendered as formatted Markdown
Where to Find AI Buttons
- Constructor: Generate Mock, Improve Mock
- API Tester: Generate Script, Generate Perf Script, Diagnose Error, API Diff, Log Analysis, Generate Collection
- Test Runs: Analyze Report (in report modal)
- Fuzzing: Analyze Finding, Batch Analyze, Batch Auto-Triage
- Recorder: Analyze Traffic, Security Audit, Find Scenarios
- Performance: Analyze Results
Customizing AI Behavior
Click the gear icon on any AI button to:
- Select AI Profile: Choose which LLM to use (fast vs. powerful models)
- Add Custom Prompt: Provide additional instructions (e.g., “Focus on security”, “Respond in Russian”, “Compare against SLA: p95 < 200ms”)
- Select MCP Tools: Enable external tools for the AI to query live data
Settings are saved per feature — your “Generate Script” settings won’t affect “Diagnose Error”.
For the complete guide to all AI features, custom prompts, and tips, see the AI Features documentation.
Agent Chat
The Agent Chat is an AI-powered assistant available on every page via a floating chat button in the bottom-right corner of the screen.
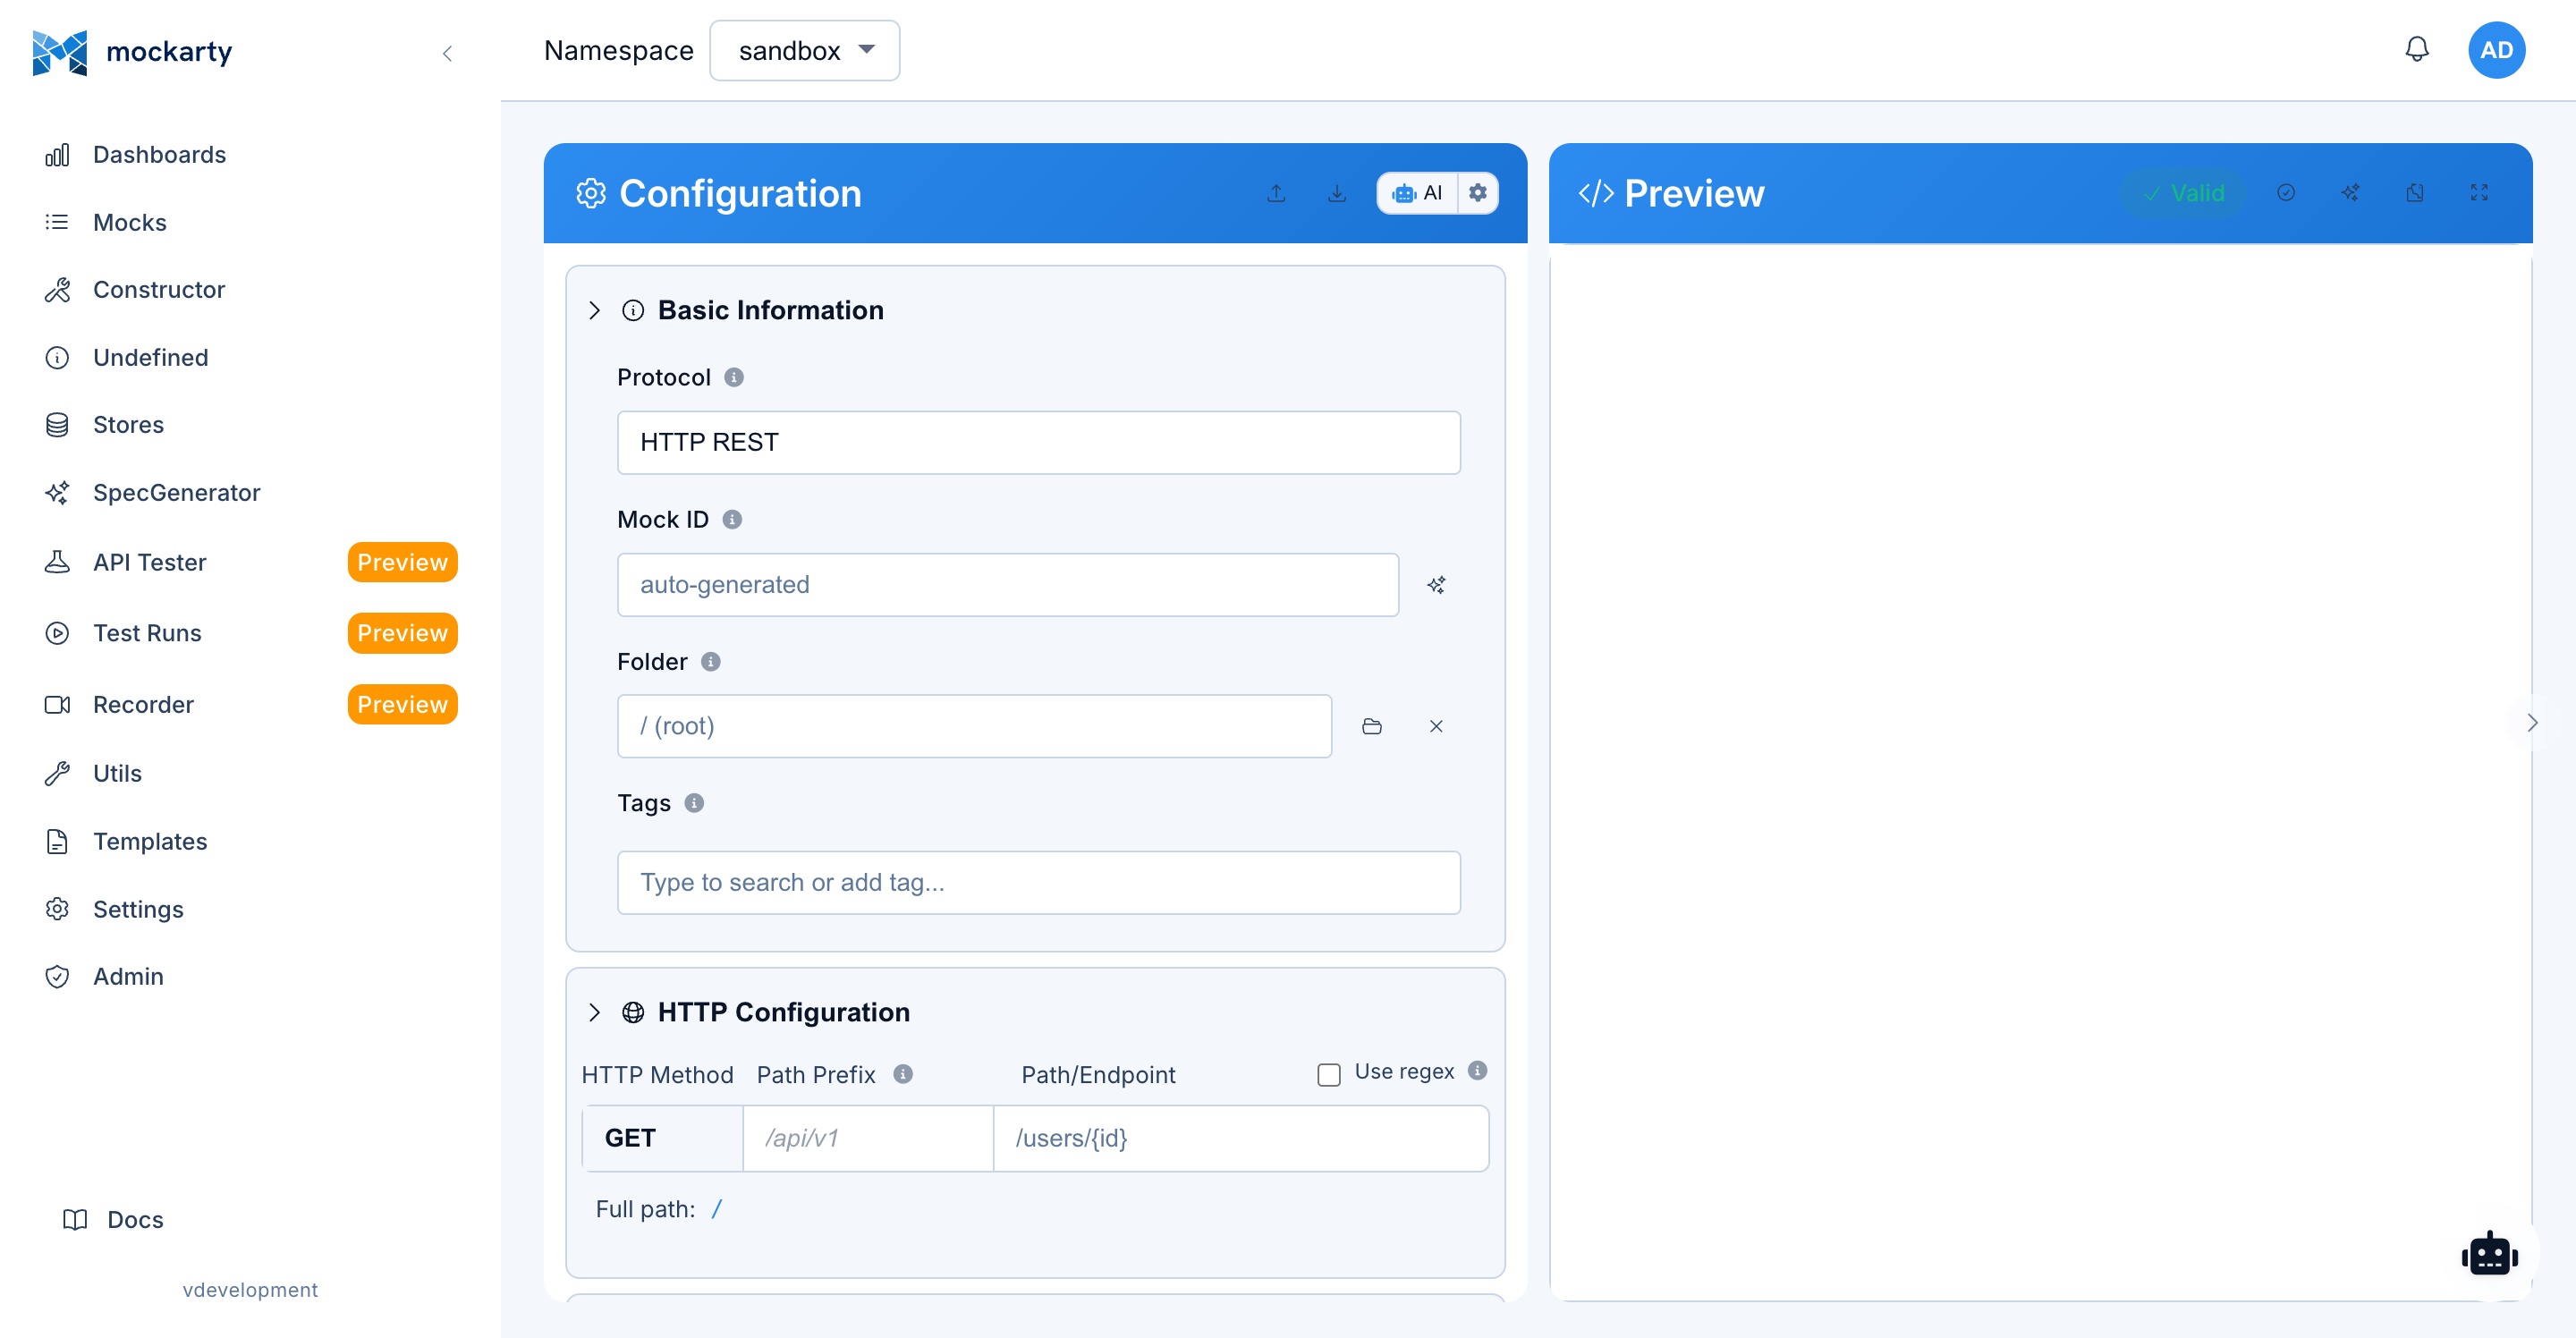
Accessing the Chat
Click the floating chat button (a speech bubble icon) to open the chat panel. The panel slides in from the right side and can be resized by dragging its left edge.
Capabilities
The Agent Chat leverages a configured LLM (OpenAI, Claude, or OpenRouter) to assist with:
- Mock creation: Describe the mock you need in natural language (e.g., “Create a GET endpoint for /api/users that returns a list of 10 users with random names and emails”). The assistant creates and configures the mock automatically.
- Mock editing: Ask the assistant to modify existing mocks (e.g., “Add a condition to the /api/users mock to return a 404 when the user ID is 0”).
- Question answering: Ask questions about Mockarty features, JsonPath syntax, Faker functions, or store usage.
- Troubleshooting: Describe an issue (e.g., “My mock is not matching requests”) and the assistant will help diagnose the problem.
- Bulk operations: Ask the assistant to create multiple related mocks in one conversation.
Conversation History
The chat maintains a conversation history for the current session. You can:
- Scroll through previous messages.
- Reference earlier parts of the conversation.
- Start a new conversation by clicking “Clear Chat”.
Agent chat sessions are persisted to the database. When you reopen a session, up to 100 previous messages are loaded automatically.
Auto-Approve Mode
By default, each tool call made by the AI assistant requires manual approval — you see Accept and Decline buttons for each action. For faster workflows, switch to Auto Approve mode:
- Open the Agent Chat panel.
- Find the Auto Approve dropdown at the top.
- Switch from Manual to Auto Approve.
In auto-approve mode, tool calls are executed immediately without waiting for confirmation. This setting is saved in your browser and persists across sessions.
Tip: Use auto-approve in sandbox/development namespaces for rapid prototyping. Keep manual mode in production namespaces for safety.
Server-Side vs. Client-Side LLM
The Agent Chat supports two modes of LLM operation:
Server-side (default):
- LLM API calls are routed through the Mockarty server
- Uses the LLM profile configured by the administrator
- No API key needed from the user
Client-side:
- LLM API calls are made directly from your browser to the LLM provider
- You provide your own API key and provider URL
- Tool execution still happens server-side
- Useful when you want to use your own OpenAI/Claude account
To use client-side mode, select a custom user profile in the chat settings and provide your API key.
Available Tools
The AI assistant has access to the following built-in tools:
| Tool | Description |
|---|---|
| Mock operations | List, create, update, and delete mocks |
| Store operations | Read and write Global, Chain, and Mock store values |
| Template management | List and apply mock templates |
| Form interaction | Fill form fields on the current page |
| HTTP request | Test HTTP endpoints to verify mocks work |
| Scope switching | Switch between page-level and global operations |
The exact tools available depend on the current page context. For example, on the Constructor page, the assistant has access to form fields and mock configuration tools.
Context Awareness
The Agent Chat is aware of:
- The current page you are viewing.
- The selected namespace and its resources.
- Available Faker functions and template syntax.
- Mockarty’s API capabilities and limitations.
This context allows the assistant to provide relevant, actionable suggestions.
Tips for Effective Prompts
- Be specific: “Create a GET /api/users/list endpoint that returns user data with fake name and email” works better than “create a user mock”
- Describe the behavior: “Return 404 when the ID is ’not-found’, otherwise return 200 with user data”
- Reference existing mocks: “Modify the /api/orders mock to add a condition for canceled orders”
- Ask for explanations: “Explain how Chain Store works for a multi-step checkout flow”
- Request bulk operations: “Create CRUD endpoints for a products resource (GET list, GET by ID, POST, PUT, DELETE)”
API Tokens
API tokens provide programmatic access to the Mockarty REST API. They are used for automation, CI/CD integration, and external tool integration. See the API Reference for the full list of available endpoints.
Accessing Token Management
API token management is available from the user dropdown menu (click your username in the top-right corner and select “API Tokens”).
Generate New Token
Click “Generate Token” to create a new API token:
- Name: Give the token a descriptive name (e.g., “CI/CD Pipeline”, “Postman Collection”).
- Expiration: Optionally set an expiration date. Expired tokens are automatically revoked.
- Scope: Tokens inherit the permissions of the user who created them.
After generation, the token is displayed once. Copy it immediately, as it cannot be retrieved later.
Token Format
API tokens use the format mk_* (for example mk_7_<random-base64-string>). Include the token in API requests using the Authorization header:
Authorization: Bearer mk_<your-token-here>
The X-API-Key: mk_<token> header is also accepted.
View and Revoke Tokens
The token management page shows all your active tokens with:
- Token name and creation date.
- Last used timestamp.
- Expiration date (if set).
Click “Revoke” to immediately disable a token. Revoked tokens cannot be restored.
Roles and Permissions
Mockarty implements a comprehensive role-based access control (RBAC) system with two levels: system roles and namespace roles.
System Roles
System roles are assigned by administrators and determine global permissions:
| Role | Dashboard | Mocks | Constructor | Stores | Generator | API Tester | Recorder | Fuzzing | Utils | Templates | Settings | Admin |
|---|---|---|---|---|---|---|---|---|---|---|---|---|
| Admin | Full | Full | Full | Full | Full | Full | Full | Full | Full | Full | Full | Full |
| Support | View | View | View | View | View | View | View | View | Full | View | Full | Limited |
| Auditor | View | View | Blocked | Blocked | Blocked | View | View | View | View | Blocked | Hidden | Audit Only |
| User | Namespace | Namespace | Namespace | Namespace | Namespace | Namespace | Namespace | Namespace | Full | Namespace | Hidden | Hidden |
For users with the “User” system role, permissions are determined by their namespace role assignments.
Namespace Roles
Namespace roles are assigned per namespace and determine what a user can do within that namespace:
| Capability | Owner | Editor | Viewer |
|---|---|---|---|
| View mocks | Yes | Yes | Yes |
| Create/edit mocks | Yes | Yes | No |
| Delete mocks | Yes | Yes | No |
| Manage stores | Yes | Yes | No |
| Run tests | Yes | Yes | No |
| Import/generate mocks | Yes | Yes | No |
| Manage namespace settings | Yes | No | No |
| Manage namespace users | Yes | No | No |
| Delete namespace | Yes | No | No |
Hidden Pages
Certain sidebar items are hidden based on the user’s system role. These restrictions are enforced server-side via Go template logic (not CSS hiding), so the HTML is never rendered for unauthorized users.
Blocked for Auditors (403 on page access):
- Constructor, Undefined Requests, Stores, Generator, and Templates pages return a 403 Forbidden response when an Auditor attempts to navigate to them.
- Settings page is hidden from the sidebar entirely.
- Auditors retain view-only access to Dashboards, Mocks, API Tester, Test Runs, Recorder, Fuzzing, Contract Testing, Chaos Engineering, Utils, and the Admin panel (audit logs only).
Hidden from Users (standard role):
- Settings is hidden. Access is reserved for Admin and Support roles only.
- Admin Panel is hidden.
Hidden by default (feature flags):
- Fuzzing, Contract Testing, and Chaos Engineering nav items are hidden by default (
style="display: none") and shown dynamically when the feature is enabled via license or user settings.
Admin Panel: Hidden from all non-Admin users (shown via client-side role check).
Tips and Best Practices
Organization
- Use namespaces to organize mocks by project, team, or environment. Each microservice or API boundary can have its own namespace, keeping mocks isolated and manageable.
- Use tags for cross-cutting categorization that spans namespaces. Tags like “regression”, “smoke-test”, “v2”, or “deprecated” help find related mocks quickly.
- Use folders within the Mocks page to create a logical hierarchy. Mirror your API’s resource structure (e.g.,
/users,/orders,/payments).
Mock Design
- Leverage Faker for realistic test data instead of hardcoded values. Responses with
$.fake.FirstName,$.fake.Email, and$.fake.UUIDare more representative of real-world scenarios and help catch serialization/parsing bugs. - Use Global Store for shared state like counters and feature flags. For example, use
$.increment(gS.orderCounter)to generate sequential order IDs across multiple mocks. - Use Chain Store for multi-step workflows. Design your mocks so that creating an order stores its ID in
cS.orderId, and subsequent GET/UPDATE/DELETE mocks reference$.cS.orderId. - Use conditions wisely. Start with broad mocks (no conditions) and add specific ones with higher priority as your test scenarios become more detailed.
- Use OneOf responses to simulate realistic behavior. Real services do not always return the same response; OneOf with random selection simulates this naturally.
Importing and Bootstrapping
- Import OpenAPI specs to quickly bootstrap mocks for an entire API. This saves significant time compared to creating mocks one by one.
- Use the Recorder to capture real traffic and convert it to mocks. This is the fastest way to create mocks that accurately represent actual service behavior.
- Import Postman collections if your team already has API testing collections. Mockarty’s API Tester is Postman-compatible and can import collections seamlessly.
Testing
- Schedule test runs for continuous validation. Run your test collections on a schedule (e.g., hourly or daily) to catch mock configuration drift.
- Use environments in the API Tester to switch between targets. Define “Local” (pointing to Mockarty), “Staging” (pointing to your staging environment), and “Production” environments with the same collection.
- Write test scripts to validate not just status codes but also response structure, data types, and business logic.
Security
- Use fuzzing regularly to test your APIs for common vulnerabilities. Even mock services can reveal input validation gaps.
- Enable 2FA for all users with write access to mocks. A compromised mock could serve malicious responses.
- Rotate API tokens periodically and revoke tokens that are no longer in use.
- Use namespace isolation to ensure teams cannot accidentally modify each other’s mocks.
Performance
- Monitor the dashboard regularly to understand traffic patterns and identify heavily-used mocks.
- Use proxy mode judiciously. While powerful, proxying adds latency. Use it for testing scenarios, not for permanent pass-through.
- Set TTL on temporary mocks to keep your namespace clean. Mocks created for one-off tests should expire automatically.
- Use cleanup policies to automatically remove old request logs, undefined requests, and test reports. This keeps the database lean and queries fast.
See Also
- Quick Start – Get up and running with Mockarty in minutes.
- API Reference – Complete REST API documentation for programmatic access.
- Faker Functions Reference – All available Faker functions for dynamic response data.
- JsonPath Guide – JsonPath syntax for request data extraction and conditions.
- Store Systems – Detailed guide to Global, Chain, and Mock stores.
- Server Generator – Generate standalone gRPC, Kafka, RabbitMQ, SMTP, and other protocol servers.
- Deployment Guide – Docker and bare-metal deployment instructions.
- Administration Guide – System administration and configuration.
- Integrations Guide – Runner agents, mock resolvers, and third-party integrations.
- Scaling Architecture – Multi-node deployment and distributed mock resolution.
- Test Case Management – Folder-based TMS with versioned steps, shared steps, and review workflows.
- Test Plans – Orchestrate multi-type test runs as a DAG workflow with CI/CD integration.
- API Fuzzing – Automated security testing with fuzz payloads.
- Contract Testing – Validate mocks against API specifications.
- Chaos Engineering – Kubernetes fault injection and resilience testing.
- Performance Testing – Load testing and APDEX scoring.
- Traffic Recorder – Capture and replay real API traffic.
- Notification Channels – Configure Telegram, email, Slack, Discord, and webhook notifications.