Traffic Recorder
The Traffic Recorder captures live HTTP/HTTPS traffic flowing through Mockarty and turns it into mocks, test collections, and performance scripts. It acts as an intercepting proxy between your application and the real upstream service, recording every request/response pair in real time.


Tip: Code examples are available for cURL, CLI, and SDK clients (Go, Python, Java). See the SDK Guide for installation and setup. See the CLI User Guide for the command-line tool.
What Is Traffic Recording?
Traffic recording means placing a proxy between your application and the services it calls, so that every HTTP request and response passing through is captured and stored for later analysis. Unlike regular application logging, which only records what your code explicitly writes to log files (log messages, error traces), traffic recording captures the full raw data: complete request URLs, headers, bodies, response status codes, response bodies, and precise timing breakdowns (DNS lookup, TLS handshake, time to first byte).
Think of it as a security camera for your API calls – every conversation between your app and its dependencies is preserved in full detail, not just the highlights your developers chose to log.
How Is This Different from Charles Proxy / Fiddler?
Charles Proxy and Fiddler are desktop GUI tools designed for manual debugging: you install them on your machine, point your browser at them, and visually inspect individual requests. Mockarty’s recorder is designed for a different workflow:
- Integrated mock generation. After recording, you can convert captured traffic into Mockarty mocks with one click – no export/import steps. Charles and Fiddler cannot generate mocks.
- Server-side deployment. The recorder runs as part of your Mockarty instance, so it can be used in CI pipelines, staging environments, and Docker-based setups – not just on a developer’s laptop.
- Test artifact export. Recorded sessions can be exported as API Tester collections, performance test scripts, or regression test suites. Desktop proxies only export HAR files.
- Toxicity simulation. You can inject latency, errors, and bandwidth throttling into the proxied traffic during recording. Charles has similar “throttle” features, but Mockarty integrates them directly into the recording session.
- HAR compatibility. Mockarty still exports standard HAR files, so you can open recordings in Chrome DevTools or Charles if needed.
Why Record Traffic?
- Auto-generate mocks from production traffic. Point your staging environment at the recorder, run your test suite, and export the captured traffic as Mockarty mocks. No manual JSON authoring.
- Debug API integration issues. See the exact bytes your application sends and receives, including headers, timing breakdowns (DNS, TLS handshake, TTFB), and compressed vs. decompressed bodies.
- Regression testing. Record a known-good session, export it as a test collection, and replay it on every CI build to catch contract changes.
- Compliance auditing. Keep a timestamped log of all API calls between your services during a compliance window.
- Chaos engineering. Inject latency, jitter, errors, and bandwidth throttling to see how your application handles degraded networks — without touching the upstream service.
How the Recorder Works (Server-Side)
The recorder runs entirely on the Mockarty server, not in your browser. When you start a recording session, Mockarty opens a proxy port (e.g. 8085) on the machine where it is deployed. Your application must be configured to send traffic to that machine’s address and port.
This is a key distinction: the recorder UI is what you see in the browser, but the actual proxy runs on the server. Understanding this is important for configuring your application correctly.
Network Setup by Deployment
| Deployment | Mockarty UI | Proxy Address (for your app) |
|---|---|---|
| Local (binary on your laptop) | http://localhost:5770/ui/recorder |
http://localhost:8085 |
| Docker (same machine) | http://localhost:5770/ui/recorder |
http://localhost:8085 (requires -p 8085:8085) |
Remote server (192.168.1.50) |
http://192.168.1.50:5770/ui/recorder |
http://192.168.1.50:8085 |
| Corporate / DNS | https://mockarty.company.com/ui/recorder |
http://mockarty.company.com:8085 |
| Kubernetes | https://mockarty.k8s.company.com/ui/recorder |
Depends on Service/Ingress configuration for port range |
Docker users: The proxy port (e.g.
8085) is separate from the main Mockarty port (5770). You must expose it explicitly:docker run -p 5770:5770 -p 8081-8999:8081-8999 .... If the port is not exposed, your application cannot reach the proxy.
Kubernetes users: The proxy ports (8081–8999) must be accessible via a Service or NodePort. Consult your cluster networking setup.
Remote Deployment
When Mockarty runs on a remote host (staging server, CI agent, Kubernetes cluster) and your application runs elsewhere, three things must line up:
- The UI is reached over one URL (e.g.
https://mockarty.company.com/ui/recorder). - The proxy port is reached directly (e.g.
http://mockarty.company.com:8085). HTTP reverse proxies like Nginx typically forward the UI path only — they do not forward the 8081–8999 range unless you explicitly configure astreamblock. - The port range 8081–8999 must be open end-to-end — host firewall, Docker
-p, Kubernetes Service/Ingress, corporate proxies, all of them.
Docker Compose example. All shipped compose files under deploy/compose/ already publish the recorder range. If you maintain your own compose, add:
services:
  mockarty:
    ports:
      - "5770:5770"              # Web UI / REST API
      - "8081-8999:8081-8999"    # Recorder proxy ports
Kubernetes example. Expose the range via a dedicated Service (NodePort or LoadBalancer). Ingress controllers usually cannot forward non-HTTP ports; prefer a Service:
apiVersion: v1
kind: Service
metadata:
  name: mockarty-recorder
spec:
  type: LoadBalancer
  selector:
    app: mockarty
  ports:
    - name: ui
      port: 5770
      targetPort: 5770
    - name: recorder
      port: 8085          # add one port per active session you expect, or use a port range via an L4 load balancer
      targetPort: 8085
For elastic allocation across 8081–8999, use a cloud load balancer that supports port ranges (AWS NLB, GCP TCP LB) or front the cluster with an L4 proxy (HAProxy, Envoy) that forwards the whole range.
Verification checklist. From the machine that runs your application under test:
# 1. Can you reach the Mockarty UI?
curl -I https://mockarty.company.com/ui/recorder

# 2. Start a recording session in the UI, note the port (e.g. 8085).
# 3. Can you reach that port directly?
curl -v http://mockarty.company.com:8085/

# If step 3 hangs or refuses, the port range is not reachable and needs a firewall/Service fix.
Recording Modes
Reverse Proxy
Your application talks to the Mockarty proxy port (e.g. :8085), and Mockarty forwards every request to the real upstream server (e.g. https://api.stripe.com).
App  ──►  Mockarty :8085  ──►  api.stripe.com
                 │
          (records traffic)
How to configure your app: Point it at the Mockarty proxy address instead of the real API. If Mockarty runs locally, this is http://localhost:8085. If Mockarty runs on a remote server at 192.168.1.50, this is http://192.168.1.50:8085.
Best for: targeting a single upstream service, local development, CI pipelines.
Forward Proxy
Mockarty acts as a classic HTTP proxy. Configure your application (or OS) to use the HTTP_PROXY environment variable pointing at the Mockarty proxy port:
App  ──HTTP_PROXY──►  Mockarty :8085  ──►  any upstream
                            │
                     (records traffic)
How to configure your app:
# If Mockarty runs locally:
export HTTP_PROXY=http://localhost:8085

# If Mockarty runs on a remote server:
export HTTP_PROXY=http://192.168.1.50:8085
# or
export HTTP_PROXY=http://mockarty.company.com:8085
HTTP requests are fully captured. HTTPS traffic is tunneled via the CONNECT method. To decrypt HTTPS, enable MITM interception.
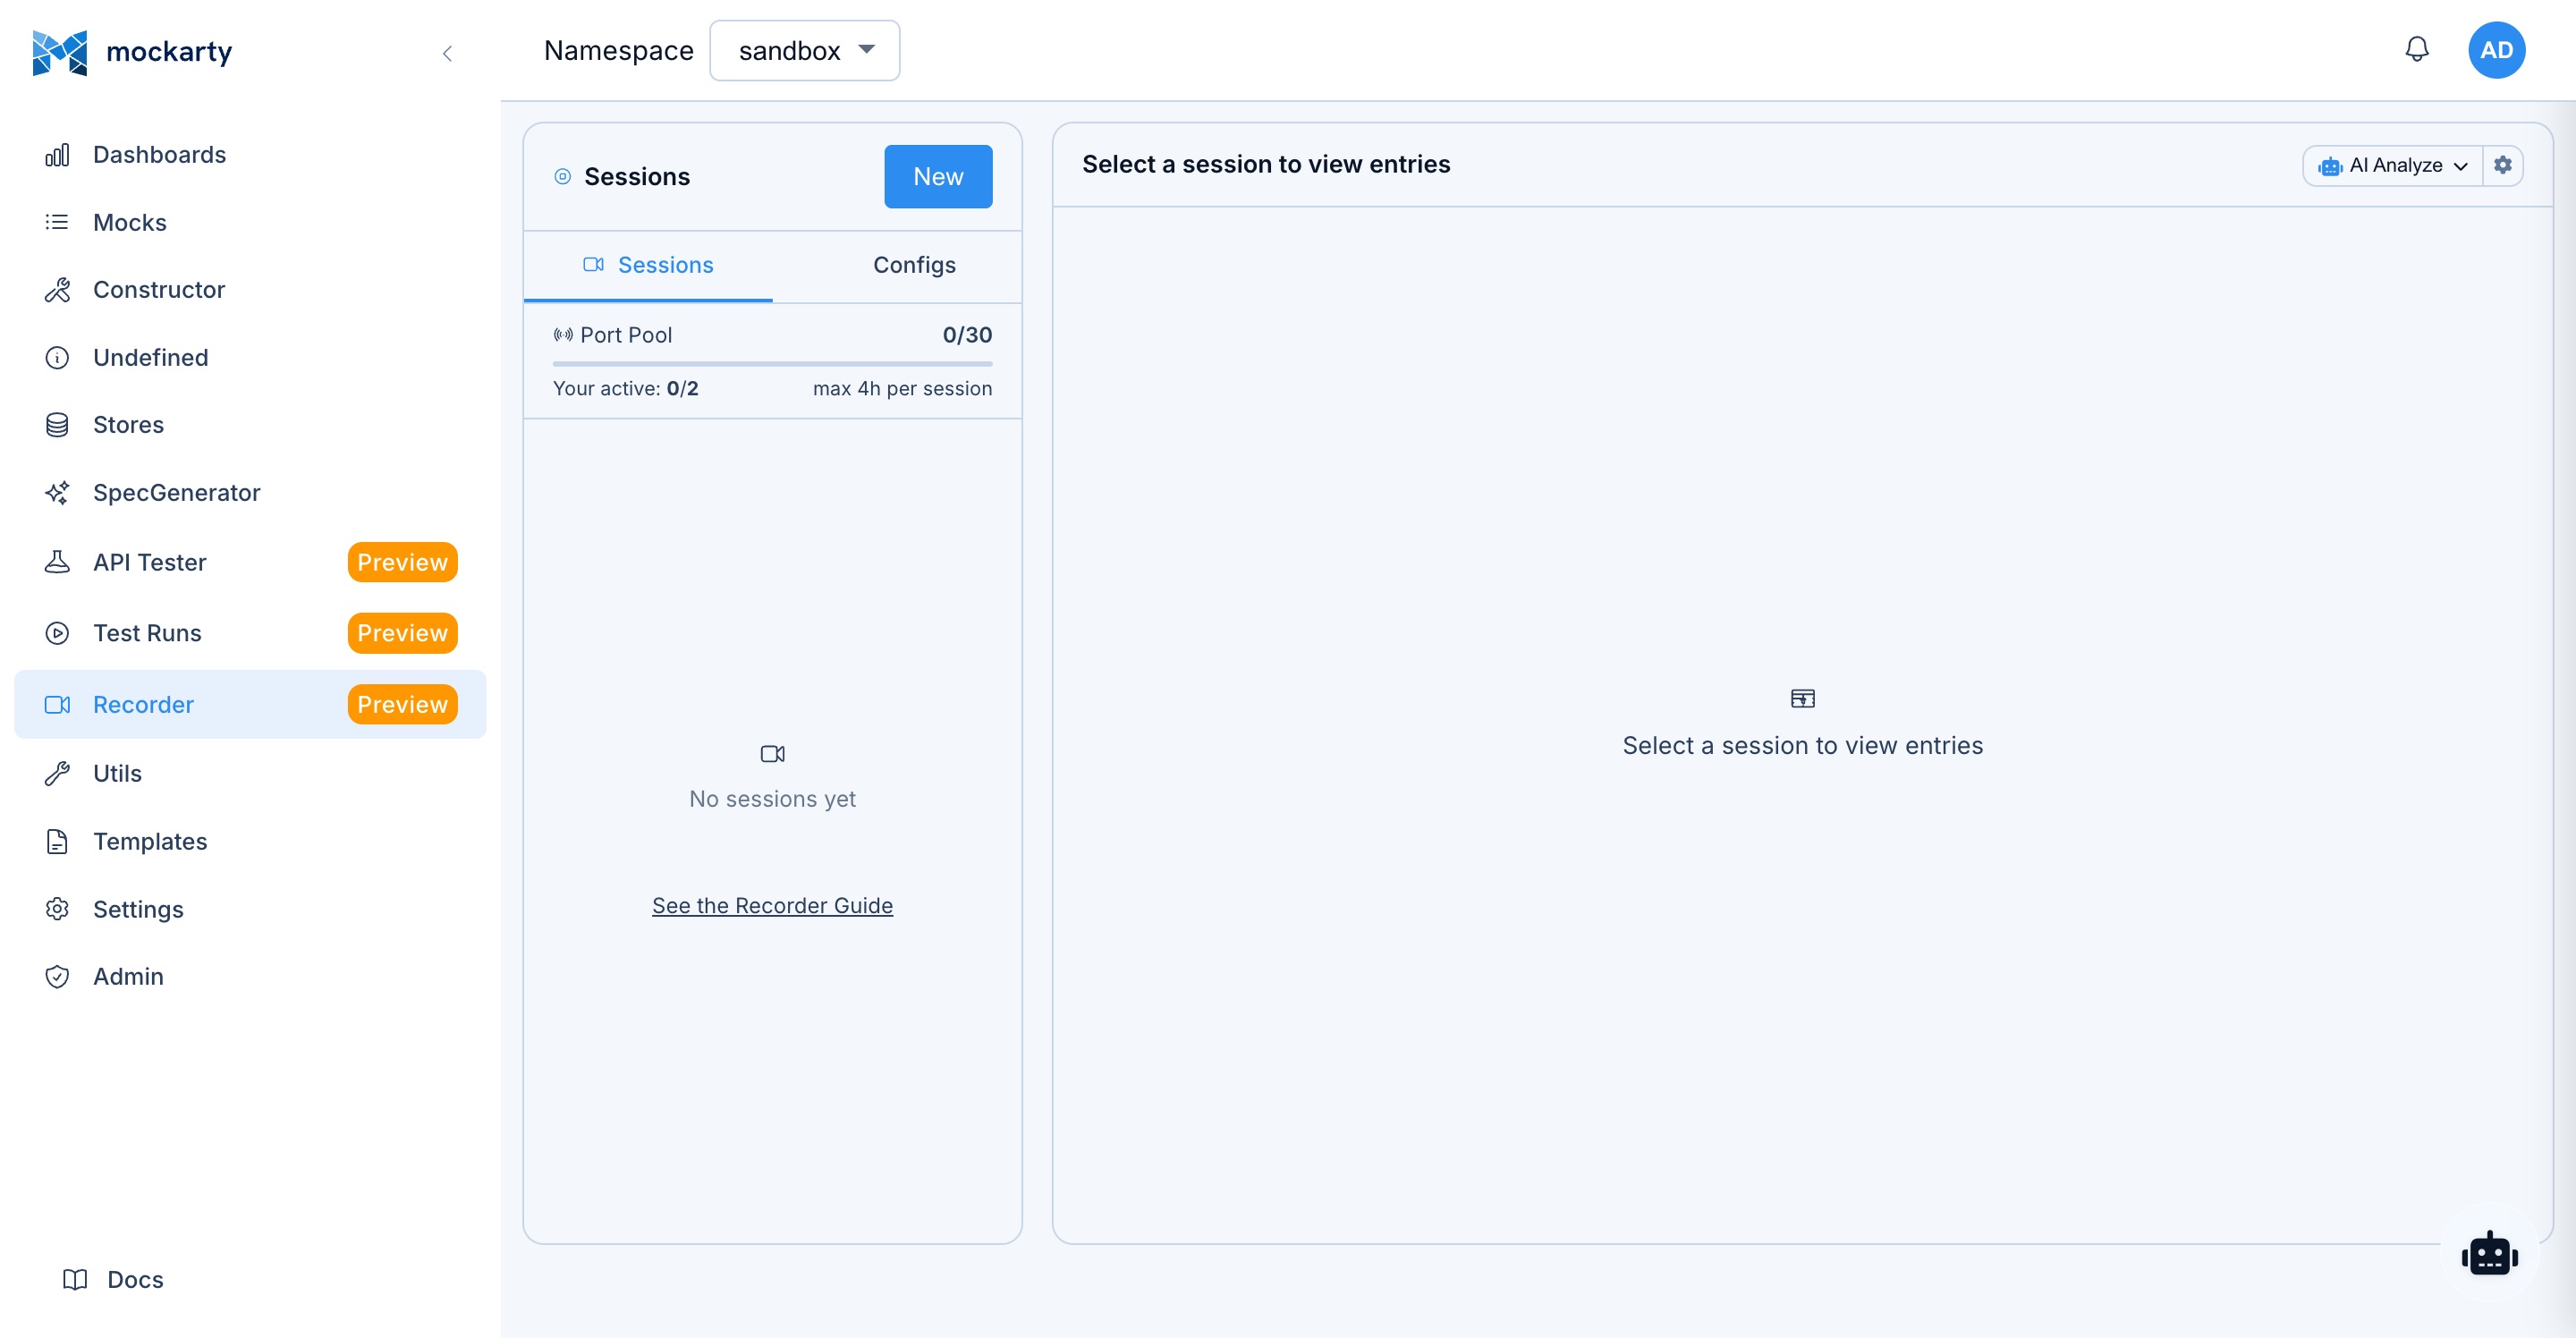
Starting a Recording Session
Via the UI
- Navigate to Recorder in the sidebar (
/ui/recorder). - Click New Session.
- Choose a mode (Reverse Proxy or Forward Proxy).
- For reverse proxy, enter the Target URL (e.g.
https://api.example.com). - Optionally set the Listen Port (auto-assigned from 8081–8999 if left blank).
- Configure filters, toxics, modifications, MITM, and Map Local as needed.
- Click Start.
The session begins recording immediately. New entries stream into the UI via WebSocket.
Via the API
cURL
curl -X POST http://localhost:5770/api/v1/recorder/start \
  -H "Content-Type: application/json" \
  -H "Authorization: Bearer <token>" \
  -d '{
    "name": "Stripe Integration Test",
    "mode": "reverse",
    "targetUrl": "https://api.stripe.com",
    "listenPort": 8085,
    "namespace": "default",
    "filters": {
      "includePaths": ["/v1/*"],
      "excludePaths": ["/v1/health"]
    },
    "toxics": {
      "http": {
        "delayMs": 100,
        "delayJitter": 50
      }
    }
  }'
CLI
mockarty-cli recorder start --name "Stripe Integration Test" \
  --target https://api.stripe.com \
  --port 8085 --session-namespace default
Note: Filters, toxics, and advanced options are available via the REST API and Web UI. The
mockarty-cli recorder startcommand creates a basic reverse-proxy session; use the API directly for full configuration.
Go
session, err := client.StartRecorderSession(&mockarty.RecorderSessionRequest{
    Name:      "Stripe Integration Test",
    TargetURL: "https://api.stripe.com",
    Port:      8085,
    Namespace: "default",
})
Python
session = client.recorder.start_recording(
    name="Stripe Integration Test",
    mode="reverse",
    target_url="https://api.stripe.com",
    listen_port=8085,
    namespace="default",
    filters={"includePaths": ["/v1/*"], "excludePaths": ["/v1/health"]},
    toxics={"delayMs": 100, "delayJitter": 50},
)
Java
var session = client.recorder().startRecording(RecorderStartRequest.builder()
    .name("Stripe Integration Test")
    .mode("reverse")
    .targetUrl("https://api.stripe.com")
    .listenPort(8085)
    .namespace("default")
    .build());
Response:
{
  "session": {
    "id": "a1b2c3d4-...",
    "name": "Stripe Integration Test",
    "mode": "reverse",
    "targetUrl": "https://api.stripe.com",
    "listenPort": 8085,
    "status": "running",
    "entryCount": 0,
    "createdAt": "2026-03-14T10:00:00Z",
    "expiresAt": "2026-03-14T14:00:00Z"
  }
}
Session Configuration Options
| Field | Type | Description |
|---|---|---|
name |
string | Human-readable label. Auto-generated if empty. |
mode |
"reverse" or "forward" |
Proxy mode. Default: "reverse". |
targetUrl |
string | Upstream URL. Required for reverse proxy. |
listenPort |
int | Port the proxy listens on. Auto-assigned (8081–8999) if 0. |
namespace |
string | Mockarty namespace. Default: "default". |
toxics |
object | Toxicity rules (delay, jitter, errors, bandwidth). |
filters |
object | Scope filters (hosts, paths, methods, status codes). |
modifications |
object | Request/response modification rules. |
mitm |
object | MITM TLS interception config. |
mapLocal |
object | Auto-responder using Mockarty mocks. |
Scope Filters
Filters control which requests are recorded. An empty filter dimension means “allow all”. All pattern strings support glob syntax.
{
  "filters": {
    "includeHosts": ["api.example.com", "*.internal.corp"],
    "excludeHosts": ["telemetry.example.com"],
    "includePaths": ["/api/*", "/v2/*"],
    "excludePaths": ["/api/healthcheck", "/api/metrics"],
    "includeMethods": ["GET", "POST", "PUT"],
    "excludeStatus": [304, 204]
  }
}
How Filters Are Evaluated
- If
includeHostsis non-empty, the request host must match at least one pattern. - If the host matches any
excludeHostspattern, the request is skipped. - Same logic for
includePaths/excludePaths. - If
includeMethodsis non-empty, the HTTP method must be in the list. - If the response status code is in
excludeStatus, the entry is discarded.
Glob Pattern Examples
| Pattern | Matches |
|---|---|
*.example.com |
api.example.com, auth.example.com |
/api/v1/* |
/api/v1/users, /api/v1/orders |
/api/*/details |
/api/users/details, /api/orders/details |
Toxicity Simulation
Inject artificial degradation into proxied traffic to test how your application handles real-world network conditions.
Toxics are configured per protocol — each protocol has its own toxic rules nested under the protocol key (http, websocket, sse, grpc):
{
  "toxics": {
    "http": {
      "delayMs": 200,
      "delayJitter": 100,
      "errorRate": 0.05,
      "errorStatus": 503,
      "bandwidthKBps": 50,
      "slowReadKBps": 10
    }
  }
}
HTTP Toxics
| Field | Type | Description |
|---|---|---|
delayMs |
int | Fixed latency (ms) added before each response. |
delayJitter |
int | Random jitter in the range ±jitter ms, added on top of delayMs. |
errorRate |
float | Fraction of requests to fail with the configured errorStatus (0.0 to 1.0). |
errorStatus |
int | HTTP status code for injected errors. Default: 503. |
bandwidthKBps |
int | Limit response throughput in KB/s. 0 = unlimited. |
slowReadKBps |
int | Throttle request body read speed in KB/s. 0 = unlimited. |
Example scenarios:
- Simulate a slow third-party API:
delayMs: 500, delayJitter: 200 - Test circuit breaker activation:
errorRate: 0.3 - Simulate mobile network conditions:
bandwidthKBps: 25, delayMs: 150 - Inject custom error codes:
errorRate: 0.1, errorStatus: 504
Modification Rules
Modify requests and responses as they pass through the proxy. Rules are applied in order. Changes affect what gets sent upstream and what your application receives, but the original request is still captured in the entry.
Header Modifications
{
  "modifications": {
    "requestHeaders": [
      { "action": "add", "name": "X-Debug", "value": "recorder" },
      { "action": "replace", "name": "Authorization", "value": "Bearer test-token" },
      { "action": "remove", "name": "X-Internal-ID" }
    ],
    "responseHeaders": [
      { "action": "add", "name": "X-Recorded", "value": "true" }
    ]
  }
}
Header rule actions: add, replace, remove.
URL Rewrites
Regex-based URL rewriting with capture group support:
{
  "modifications": {
    "urlRewrites": [
      {
        "match": "/api/v1/(.*)",
        "replace": "/api/v2/$1"
      }
    ]
  }
}
Body Replacements
Replace text in response bodies using plain strings or regex:
{
  "modifications": {
    "bodyReplacements": [
      {
        "match": "production-db.internal",
        "replace": "localhost:5432",
        "isRegex": false
      },
      {
        "match": "\"apiKey\":\\s*\"[^\"]+\"",
        "replace": "\"apiKey\": \"REDACTED\"",
        "isRegex": true
      }
    ]
  }
}
Field Mods (JSON path)
Body Replacements operate on the whole body as raw text. Field Mods target a
single field of a JSON body by its path — a partial substitution that leaves
the rest of the payload byte-for-byte intact. Use them to mask one value (an
email, a token), zero a price, or strip a secret without writing a fragile regex
over the entire body. Non-JSON bodies are left untouched. Compressed responses
(gzip, deflate) are decompressed automatically before the rule is applied,
so field mods work the same whether or not the upstream compresses its replies.
Field mods are applied on every proxy mode — reverse, forward, and HTTPS
interception (MITM). They apply to buffered request/response bodies; streaming
responses (Server-Sent Events, WebSocket) and very large bodies above the
rewrite cap pass through unmodified.
Each rule has a path, an op, and (depending on the op) a value/match:
path— dot-separated. Object keys by name, array elements by index, and
*as a wildcard over every key of an object or every element of an array.
Examples:user.email,items.0.price,items.*.price,secrets.*.op: "set"— overwrite the field withvalue.valueis interpreted as
JSON when it parses cleanly (0→ number,true→ boolean,null→ null,
{"a":1}→ object), otherwise it is used verbatim as a string. On an object
the key is created if it does not exist.op: "replace"— regex-replacematch→valueinside the field’s
string value (no-op when the field is not a string). An emptymatchsets the
string outright.op: "remove"— delete the object key (or null out the array element).
requestFields applies to request bodies, responseFields to response bodies:
{
  "modifications": {
    "requestFields": [
      { "path": "user.email", "op": "replace", "match": "@.*$", "value": "@masked.local" }
    ],
    "responseFields": [
      { "path": "items.*.price", "op": "set", "value": "0" },
      { "path": "account.token", "op": "remove" }
    ]
  }
}
Updating Modifications on a Running Session
You can update modification rules without restarting the session:
curl -X PUT http://localhost:5770/api/v1/recorder/<session-id>/modifications \
  -H "Content-Type: application/json" \
  -d '{
    "modifications": {
      "requestHeaders": [
        { "action": "add", "name": "X-Trace", "value": "123" }
      ]
    }
  }'
Map Local (Auto-Responder)
When Map Local is enabled, the proxy checks whether a matching Mockarty mock exists before forwarding to the upstream. If a mock matches, its response is served locally without any network call. The entry is flagged with "mapLocal": true.
{
  "mapLocal": {
    "enabled": true,
    "namespace": "staging"
  }
}
If namespace is omitted, the session’s default namespace is used.
Use cases:
- Stub out a flaky upstream endpoint during recording.
- Inject specific error responses for edge-case testing.
- Combine real traffic with mocked endpoints in a single session.
How matching works: The recorder matches mocks by route pattern (regex) and HTTP method within the specified namespace. Mock conditions (body, headers, query params) are not evaluated during Map Local — only the first mock matching the route and method is served.
SSL/TLS Interception (MITM)
Note: If you only need to record HTTP (non-encrypted) traffic, you do not need MITM setup at all. Simply use reverse proxy mode pointed at your upstream service, or forward proxy mode without MITM enabled. The setup below is only required when you need to decrypt and inspect HTTPS traffic in forward proxy mode.
In forward proxy mode, HTTPS traffic is tunneled via CONNECT and encrypted end-to-end by default. To decrypt and record HTTPS request/response bodies, enable MITM interception.
How It Works
- Mockarty generates a self-signed CA certificate (ECDSA P-256, 10-year validity).
- When a CONNECT tunnel is established, Mockarty generates a leaf certificate for the target hostname, signed by the CA.
- Your application (or browser) performs the TLS handshake with Mockarty’s leaf certificate.
- Mockarty opens a separate TLS connection to the real server.
- Decrypted HTTP traffic is recorded, then re-encrypted and forwarded.
Setup
Step 1: Generate the CA
curl -X POST http://localhost:5770/api/v1/recorder/ca/generate
Step 2: Download and trust the CA certificate
curl -o mockarty-ca.pem http://localhost:5770/api/v1/recorder/ca/download
Install the certificate in your OS or browser trust store:
- macOS:
sudo security add-trusted-cert -d -r trustRoot -k /Library/Keychains/System.keychain mockarty-ca.pem - Linux (Ubuntu/Debian): Copy to
/usr/local/share/ca-certificates/mockarty-ca.crtand runsudo update-ca-certificates - Windows: Double-click the
.pemfile and install to “Trusted Root Certification Authorities” - Node.js: Set
NODE_EXTRA_CA_CERTS=mockarty-ca.pem - Go: Set
SSL_CERT_FILE=mockarty-ca.pem
Step 3: Enable MITM when starting a session
curl -X POST http://localhost:5770/api/v1/recorder/start \
  -H "Content-Type: application/json" \
  -d '{
    "mode": "forward",
    "mitm": { "enabled": true },
    "listenPort": 8085
  }'
Step 4: Configure your application
export HTTP_PROXY=http://localhost:8085
export HTTPS_PROXY=http://localhost:8085
All HTTPS traffic will now be decrypted, recorded, and re-encrypted transparently.
Exporting Recorded Traffic
HAR File
Export the session (or selected entries) as a HAR file, compatible with Chrome DevTools, Charles Proxy, and other tools.
curl -X POST http://localhost:5770/api/v1/recorder/<session-id>/export \
  -H "Content-Type: application/json" \
  -d '{ "entryIds": [] }' \
  -o recording.har
Pass specific entryIds to export a subset, or an empty array for all entries.
Postman Collection v2.1
Export the same traffic as a Postman Collection v2.1 JSON file. The result imports cleanly into Postman and Insomnia (which also speaks v2.1):
curl -X POST http://localhost:5770/api/v1/recorder/<session-id>/export-postman \
  -H "Content-Type: application/json" \
  -d '{ "entryIds": [] }' \
  -o recording.postman_collection.json
The same is available from the CLI:
mockarty-cli recorder export <session-id> --format=postman --out recording.postman_collection.json
Multi-host captures are grouped into one folder per hostname so the result stays navigable. WebSocket, SSE, gRPC, MCP, SOAP and S3 entries are surfaced as items with a description (Postman v2.1 has no native item kind for those protocols, so the payload travels in the response example).
Mock Generation
Convert recorded entries directly into Mockarty mocks:
curl -X POST http://localhost:5770/api/v1/recorder/<session-id>/mocks \
  -H "Content-Type: application/json" \
  -d '{
    "entryIds": [],
    "namespace": "default",
    "prefix": "rec-",
    "tags": ["recorded", "payment-api"],
    "priority": 5
  }'
Options:
| Field | Description |
|---|---|
entryIds |
Entries to convert. Empty = all. |
namespace |
Target namespace for created mocks. |
prefix |
ID prefix for generated mocks (e.g. rec-). |
tags |
Tags applied to every generated mock. |
chainId |
Optional chain ID for linking mocks into a workflow. |
forceUpdate |
Overwrite existing mocks with the same ID. |
priority |
Default priority for generated mocks. |
useHeadersAsConditions |
Turn the captured request headers into header match conditions on each generated mock (volatile headers like Date are skipped). Off by default. |
inferDynamicResponseFields |
Replace unambiguously dynamic literals in the captured response bodies (UUIDs, timestamps) with $.fake.* template calls, so the generated mock returns fresh values. Off by default. |
Test Collection
Export entries as an API Tester collection for replay testing:
curl -X POST http://localhost:5770/api/v1/recorder/<session-id>/export-collection \
  -H "Content-Type: application/json" \
  -d '{
    "collectionName": "Payment Flow Regression",
    "namespace": "default",
    "protocol": "http"
  }'
Set protocol to "tests" to generate a test script with assertions, or "performance" to generate a performance load script.
Performance Script
Export as a standalone JavaScript performance script:
curl -X POST http://localhost:5770/api/v1/recorder/<session-id>/export-perf \
  -H "Content-Type: application/json" \
  -d '{ "entryIds": [] }' \
  -o perf-script.js
Test Script
Export as a JavaScript test script with assertions:
curl -X POST http://localhost:5770/api/v1/recorder/<session-id>/export-test \
  -H "Content-Type: application/json" \
  -d '{ "entryIds": [] }' \
  -o test-script.js
Session Management
Limits
| Limit | Value |
|---|---|
| Max concurrent sessions (global) | 30 |
| Max sessions per user | 2 |
| Max entries per session | 1,000 (FIFO eviction) |
| Session auto-expiry | 4 hours |
| Entry retention after stop | 5 days |
| Listen port range (auto-assign) | 8081–8999 |
| Saved configs per user | 10 |
| Max body capture size | 1 MiB (bodies exceeding this limit are truncated) |
When a session reaches 1,000 entries, the oldest entry is evicted automatically. WebSocket subscribers receive an eviction notification so the UI stays in sync.
Session Lifecycle
- Running — proxy is active, entries are being captured.
- Stopped — proxy is shut down, entries remain accessible for export. Sessions that reach the 4-hour auto-expiry limit transition to this status automatically.
Saved Configurations
Save frequently used session configs for quick reuse:
# Save a config
curl -X POST http://localhost:5770/api/v1/recorder/configs \
  -H "Content-Type: application/json" \
  -d '{
    "name": "Stripe Dev",
    "mode": "reverse",
    "targetUrl": "https://api.stripe.com",
    "filters": { "includePaths": ["/v1/*"] }
  }'

# List saved configs
curl http://localhost:5770/api/v1/recorder/configs

# Export a config as JSON
curl http://localhost:5770/api/v1/recorder/configs/<config-id>/export -o config.json

# Import a config from JSON
curl -X POST http://localhost:5770/api/v1/recorder/configs/import \
  -H "Content-Type: application/json" \
  -d @config.json
Real-Time Streaming
Connect a WebSocket to receive entries as they are captured:
ws://{MOCKARTY_HOST}:{PORT}/api/v1/recorder/<session-id>/ws
For example: ws://localhost:5770/api/v1/recorder/<session-id>/ws (local) or wss://mockarty.company.com/api/v1/recorder/<session-id>/ws (remote with TLS).
Each message is a JSON object:
{
  "type": "entry",
  "entry": {
    "id": "...",
    "entryType": "http",
    "request": { "method": "GET", "url": "..." },
    "response": { "statusCode": 200 },
    "durationMs": 42,
    "timings": { "dnsMs": 2, "connectMs": 5, "tlsMs": 12, "sendMs": 1.2, "recvMs": 8.5, "waitMs": 20, "totalMs": 42 }
  }
}
An eviction notification looks like:
{ "type": "entry", "entry": { "id": "__evict__", "notes": "<evicted-entry-id>" } }
Entry Annotations
Tag and annotate individual entries for later reference:
curl -X PATCH http://localhost:5770/api/v1/recorder/<session-id>/entries/<entry-id> \
  -H "Content-Type: application/json" \
  -d '{
    "tags": ["bug", "timeout"],
    "notes": "This request took 8 seconds — investigate upstream latency"
  }'
Entry Replay
Replay a captured request against the original (or a different) server:
curl -X POST http://localhost:5770/api/v1/recorder/<session-id>/entries/<entry-id>/replay \
  -H "Content-Type: application/json" \
  -d '{
    "url": "http://api.staging.example.com/api/users/123",
    "headers": { "Authorization": "Bearer new-token" }
  }'
Override any field (method, url, headers, body) or leave the body empty to replay as-is.
Session Replay
Re-run every captured entry against either the original URL or a different target. Useful for staging-vs-production parity checks, smoke-testing a new deployment with realistic traffic, and regression testing after backend refactors. The endpoint returns a summary with matched, mismatched, failed, and skipped counts plus per-entry results.
cURL
curl -X POST http://localhost:5770/api/v1/recorder/<session-id>/replay \
  -H "Content-Type: application/json" \
  -H "Authorization: Bearer $MOCKARTY_API_TOKEN" \
  -d '{
    "targetUrl": "https://staging.example.com",
    "concurrency": 5,
    "timeoutSeconds": 5,
    "followRedirects": true
  }'
CLI
mockarty-cli recorder replay <session-id> \
  --target https://staging.example.com \
  --concurrency 5 \
  --timeout-ms 5000 \
  --follow-redirects

# Or replay only specific entries:
mockarty-cli recorder replay <session-id> --entries entry-1,entry-2
Go SDK
summary, err := client.Recorder().ReplaySession(ctx, sessionID, &mockarty.ReplayOptions{
    TargetURL:       "https://staging.example.com",
    Concurrency:     5,
    TimeoutMs:       5000,
    FollowRedirects: true,
})
if err != nil {
    log.Fatal(err)
}
fmt.Printf("matched=%d failed=%d\n", summary.Matched, summary.Failed)
Python SDK
summary = client.recorder.replay_session(
    session_id,
    options={
        "targetUrl": "https://staging.example.com",
        "concurrency": 5,
        "timeoutSeconds": 5,
        "followRedirects": True,
    },
)
print(f"matched={summary['matched']} failed={summary['failed']}")
Java SDK
Map<String, Object> summary = client.recorder().replaySession(sessionId, Map.of(
        "targetUrl", "https://staging.example.com",
        "concurrency", 5,
        "timeoutSeconds", 5000,
        "followRedirects", true
));
System.out.println("matched=" + summary.get("matched") +
                   " failed=" + summary.get("failed"));
Correlation Engine
Discover dynamic values that flow between captured entries. The deterministic value-matching engine scans every entry’s response (JSON, headers, Set-Cookie) for values that are then re-used by a later entry’s request (URL, header, body, form, cookie). The output highlights tokens, IDs and CSRF values that need to be extracted at runtime instead of being hard-coded from the original capture — exactly what you need before turning a recording into an automated test scenario.
cURL
curl -X POST http://localhost:5770/api/v1/recorder/<session-id>/correlate \
  -H "Content-Type: application/json" \
  -H "Authorization: Bearer $MOCKARTY_API_TOKEN" \
  -d '{
    "minValueLength": 6,
    "excludeNumeric": false,
    "maxCorrelationsPerSource": 50
  }'
CLI
mockarty-cli recorder correlate <session-id> \
  --min-len 6 \
  --max-per-source 50

# Skip numeric-only values like integer IDs:
mockarty-cli recorder correlate <session-id> --exclude-numeric
Go SDK
report, err := client.Recorder().CorrelateSession(ctx, sessionID, &mockarty.CorrelationOptions{
    MinValueLength: 6,
    ExcludeNumeric: false,
})
if err != nil {
    log.Fatal(err)
}
for _, c := range report.Correlations {
    fmt.Printf("[%s] %s = %q (confidence %.2f, %d targets)\n",
        c.ValueType, c.Source.Section, c.Value, c.Confidence, len(c.Targets))
}
Python SDK
report = client.recorder.correlate_session(
    session_id,
    options={"minValueLength": 6, "excludeNumeric": False},
)
for c in report["correlations"][:5]:
    print(f"[{c['valueType']}] {c['source']['section']}={c['value']!r}"
          f" (confidence {c['confidence']:.2f}, {len(c['targets'])} targets)")
Java SDK
Map<String, Object> report = client.recorder().correlateSession(sessionId, Map.of(
        "minValueLength", 6,
        "excludeNumeric", false
));
@SuppressWarnings("unchecked")
List<Map<String, Object>> corrs =
        (List<Map<String, Object>>) report.getOrDefault("correlations", List.of());
for (Map<String, Object> c : corrs) {
    System.out.println(c.get("valueType") + " = " + c.get("value")
            + " (confidence " + c.get("confidence") + ")");
}
API Reference
All endpoints are under /api/v1/recorder. Authentication required.
Sessions
| Method | Path | Description |
|---|---|---|
POST |
/start |
Start a new recording session |
GET |
/sessions |
List sessions for the current user |
GET |
/:id |
Get a single session |
POST |
/:id/stop |
Stop a running session |
POST |
/:id/restart |
Restart a stopped session (same config, new port if needed) |
DELETE |
/:id |
Delete a session and its entries |
Entries
| Method | Path | Description |
|---|---|---|
GET |
/:id/entries?offset=0&limit=100 |
List entries (paginated) |
PATCH |
/:id/entries/:entryId |
Annotate an entry (tags, notes) |
POST |
/:id/entries/:entryId/replay |
Replay a single captured request |
POST |
/:id/replay |
Replay every (or selected) entry against a target — returns match/fail summary |
POST |
/:id/correlate |
Run the deterministic correlation engine — discovers dynamic-value flow between entries |
GET |
/:id/ws |
WebSocket stream of new entries |
Export
| Method | Path | Description |
|---|---|---|
POST |
/:id/export |
Export as HAR file |
POST |
/:id/export-perf |
Export as performance script |
POST |
/:id/export-test |
Export as test script |
POST |
/:id/export-collection |
Export as API Tester collection |
POST |
/:id/mocks |
Generate Mockarty mocks from entries |
Modifications
| Method | Path | Description |
|---|---|---|
GET |
/:id/modifications |
Get current modification rules |
PUT |
/:id/modifications |
Update modification rules (live) |
CA Certificate (MITM)
| Method | Path | Description |
|---|---|---|
GET |
/ca/status |
Check if a CA exists |
POST |
/ca/generate |
Generate (or return existing) CA |
GET |
/ca/download |
Download CA certificate PEM file |
Saved Configurations
| Method | Path | Description |
|---|---|---|
GET |
/configs |
List saved configs |
POST |
/configs |
Save a new config (max 10 per user) |
DELETE |
/configs/:id |
Delete a saved config |
GET |
/configs/:id/export |
Export config as JSON file |
POST |
/configs/import |
Import config from JSON |
AI Analysis
| Method | Path | Description |
|---|---|---|
POST |
/:id/ai-analyze |
AI analysis of recorded traffic (accepts analysisType: traffic, security, correlate) |
POST |
/:id/ai-scenarios |
Generate test scenarios from recorded traffic |
Utility
| Method | Path | Description |
|---|---|---|
GET |
/ports |
Port pool status (used/max/details) |
GET |
/port-check?port=8085 |
Check if a port is available |
Practical Examples
Example 1: Recording a Payment API Integration
Record all traffic between your checkout service and Stripe during a test purchase:
# 1. Start a recording session
curl -X POST http://localhost:5770/api/v1/recorder/start \
  -H "Content-Type: application/json" \
  -d '{
    "name": "Checkout Flow",
    "mode": "reverse",
    "targetUrl": "https://api.stripe.com",
    "filters": {
      "includePaths": ["/v1/charges", "/v1/payment_intents", "/v1/customers"],
      "includeMethods": ["POST", "GET"]
    }
  }'
# Returns session ID and listen port (e.g. 8081)

# 2. Point your checkout service at the recorder proxy address.
#    Replace localhost with the Mockarty server address if running remotely:
#    - Local:  http://localhost:8081
#    - Remote: http://192.168.1.50:8081  or  http://mockarty.company.com:8081
export STRIPE_API_BASE=http://localhost:8081

# 3. Run your test purchase flow
./run-checkout-tests.sh

# 4. Stop the session
curl -X POST http://localhost:5770/api/v1/recorder/<session-id>/stop
Example 2: Generating Mocks from a Recording
After recording, convert captured traffic into mocks that replay the same responses:
curl -X POST http://localhost:5770/api/v1/recorder/<session-id>/mocks \
  -H "Content-Type: application/json" \
  -d '{
    "namespace": "checkout-tests",
    "prefix": "stripe-",
    "tags": ["stripe", "recorded"]
  }'
Now your checkout tests can run against Mockarty mocks with no network dependency.
Preserving a workflow chain. When a recording is a multi-step flow (create → fetch → update), values produced by one response are often consumed by a later request. Add ?variableize=1 to keep that linkage in the generated mocks:
curl -X POST "http://localhost:5770/api/v1/recorder/<session-id>/mocks?variableize=1" \
  -H "Content-Type: application/json" \
  -d '{ "namespace": "checkout-tests", "prefix": "stripe-" }'
Each correlated value (e.g. an id returned by the create call and reused in the fetch call) is rewritten as a variable, and the mock that produced it gets a chain-store extractor ($.cS.<name>) so the mocks stay linked as one workflow. In the UI this is the Correlate chained values checkbox in the Create Mocks from Traffic modal.
Example 3: Creating Regression Tests
Export the recording as a test collection that asserts status codes and response shapes:
curl -X POST http://localhost:5770/api/v1/recorder/<session-id>/export-collection \
  -H "Content-Type: application/json" \
  -d '{
    "collectionName": "Stripe Regression Suite",
    "protocol": "tests"
  }'
The collection appears in the API Tester and can be run on every CI build.
Example 4: Chaos Testing with Toxics
Simulate a degraded Stripe API to test your retry and timeout logic:
curl -X POST http://localhost:5770/api/v1/recorder/start \
  -H "Content-Type: application/json" \
  -d '{
    "name": "Stripe Chaos Test",
    "mode": "reverse",
    "targetUrl": "https://api.stripe.com",
    "toxics": {
      "http": {
        "delayMs": 3000,
        "delayJitter": 1000,
        "errorRate": 0.2
      }
    }
  }'
20% of requests will return HTTP 503, and the remaining 80% will have 2-4 seconds of added latency.
Supported Entry Types
The recorder captures seven protocol types:
| Type | Description |
|---|---|
http |
Standard HTTP request/response pairs |
websocket |
WebSocket connections with individual frame capture |
sse |
Server-Sent Event streams with individual event capture |
grpc |
gRPC unary and streaming calls |
soap |
SOAP/XML request/response envelopes |
mcp |
Model Context Protocol interactions |
s3 |
S3 (AWS) API calls — detected by SigV4 + x-amz-* headers |
GraphQL requests are automatically detected and annotated with operation name and type in the graphqlInfo field.
See Also
- Quick Start — Get Mockarty running in minutes
- API Reference — Full REST API documentation
- UI User Guide — Web interface walkthrough
- Stores — Global, Chain, and Mock store systems
- Performance Testing — Export recorded traffic as performance scripts
- Webhooks & Callbacks — Trigger HTTP, Kafka, or RabbitMQ callbacks from mocks
- Fuzzing — Import recorded requests as fuzzing seeds