Browser & Mobile UI Testing
Drive a real browser (Chromium, Firefox, WebKit) or a real Android device through a live session — inspect the screen, act on elements by meaning, add assertions, record the flow as a replayable test, run it, and export it as Playwright or Appium code. Built for two audiences at once: people drive it hands-on, and an AI agent can author and run UI tests end-to-end on its own.
What you can do
- Logs — during a live browser session, read warnings and errors, with source locations and repeat counts when available. Ordinary
console.logmessages are not captured. Mobile sessions show the device log instead. Automatic refresh follows new entries and stops polling when you leave the page. A notice shows when older entries have been omitted from the bounded journal. - Live session — open a target URL (or app) on a runner; the runner streams its screen and accepts your commands.
- Inspect — read the on-screen elements with stable selectors (id, data-testid, aria-label, placeholder, visible text) and bounding boxes. You pick elements by meaning, never by raw pixels.
- Act — click, fill, press, tap an element by its text/selector.
- Assert — verify the page in the familiar form:
assertVisible,assertText,assertValue,assertEnabled,assertChecked,assertURL,assertTitle, and more. Each assertion is checked live and becomes a step in the recording. - Record → Save → Replay — every action and assertion is captured; save it as a reusable UI test and replay it later on any matching runner. A saved test remembers the platform it was recorded on (and, for mobile, the app under test), so replaying it is one click — no settings to re-enter.
- Export — turn a recording into idiomatic Playwright (TypeScript) or Appium (Python) code to take into your own repository.
The UI Testing page
If Stop cannot be confirmed, the studio keeps the current session and recording visible and shows an error. Retry Stop; do not close the page until the request succeeds.
For a remote runner, Stop requested means the cancellation was accepted but the runner may still be finishing. It is not a confirmation that execution has already ended.
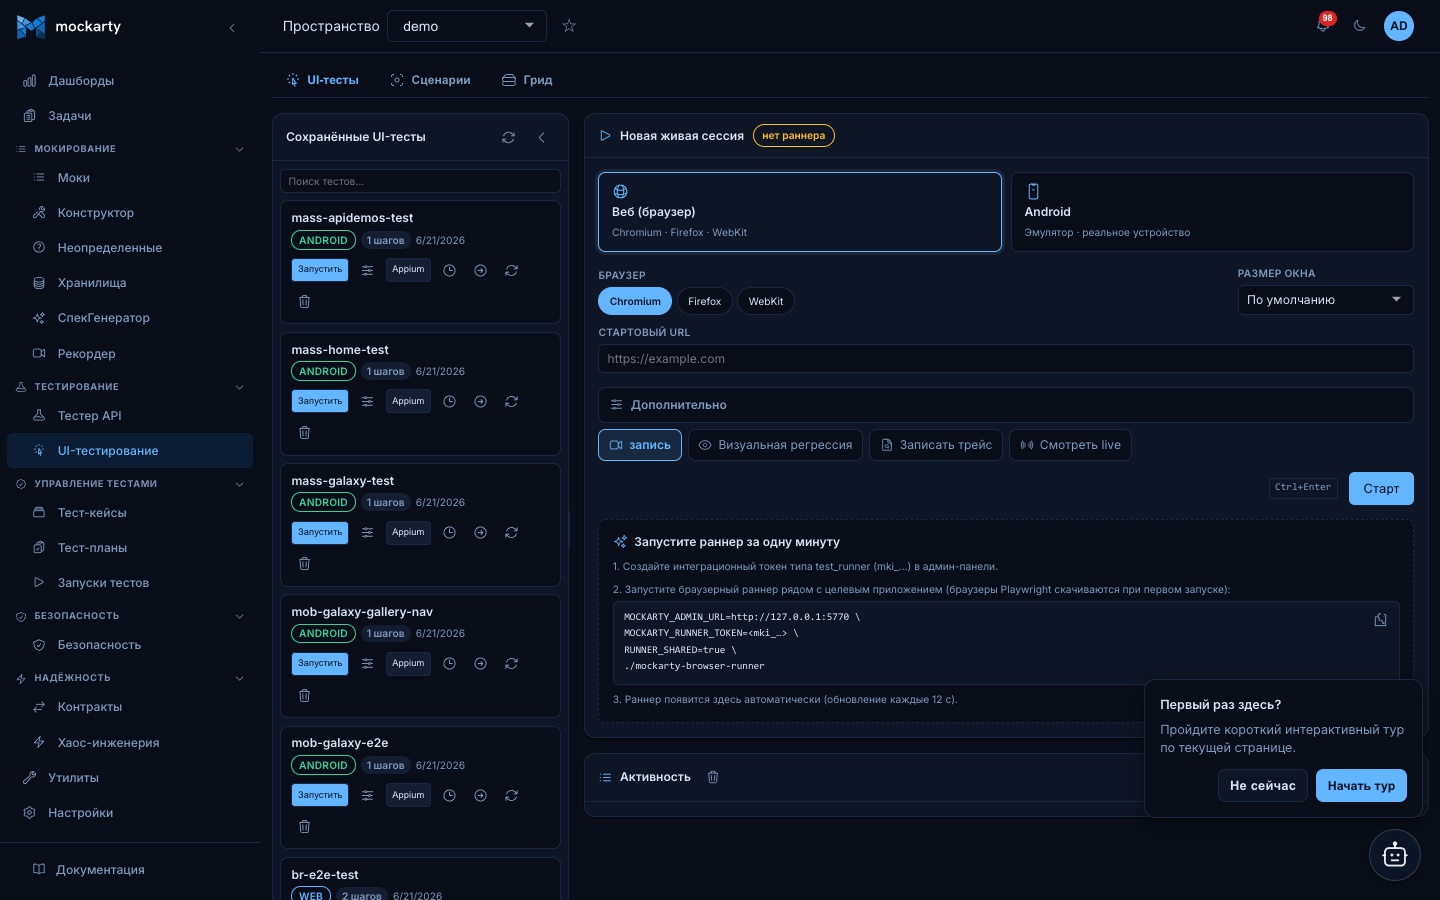
Everything above is available visually under UI Testing in the sidebar:
- Pick the platform — Web (browser) or Android — and the form adapts: engine + viewport + start URL for web; the application and an optional deeplink for Android.
- Pick the engine right there. The Engine row shows exactly what this installation can actually run: the lightweight engine, real browsers — whatever the runner fleet offers, the Mockarty server itself included. What nobody offers is not listed, so you cannot pick a browser by mistake. Hover an option to see how many runners provide it. Auto (the default) leaves the choice to the server. An option marked ⚠ runs the steps but produces no pixels: screenshots, visual comparisons and the live view are unavailable on it here — which is also why it sits out a cross-engine run.
- For Android, choose an APK you already uploaded, upload one right there (Upload APK), or point at an app already installed on the device by package id.
- Deleting an uploaded app removes it from the list and prevents new downloads immediately. Storage space may be reclaimed later by the background cleanup. If many builds are being uploaded at once, wait briefly and retry a rejected upload.
- Start the session and watch the live screen. Click Inspect to overlay the on-screen elements; click an element on the stream to tap it, or click its row in the Elements panel for more: tap, fill a value, assert it’s visible, assert its text, copy its selector. Clicking free space on the stream taps that exact spot.
- Type with your keyboard. Click a field on the stream, then just type — keystrokes go to the live page/device (Enter, Backspace, Tab and the arrows work too).
- The assert toolbar verifies the page live (
assertVisible,assertText,assertURL, …) — every check becomes a step of the recording. - To fill an assertion target from the live screen, focus #selector / text, then click the element on the stream. This selects its locator without clicking the control in the tested application. Enter the expected value if the chosen assertion needs one, then press Assert. Expand the session to use the full window; long element lists scroll inside the side panel. Stop lets you save the recording, discard it, or return to the session.
- The recording is an editable script. Every action and assertion appears as a numbered card in the Steps panel (an asserted step shows a ✓/✗ verdict). While you record you can drag a card to reorder, double-click its title to rename it from the auto-generated label to something readable, disable a step (kept but skipped on the next run), and delete a stray step — so what you save is exactly the flow you want. Two more controls decide how a step behaves when things go wrong: allow it to fail (it still runs and a failure is still reported, but the run continues and its verdict is unaffected — for a cookie banner only new visitors see), and run it only if an earlier named step passed (otherwise it is skipped, not failed, because nothing was tried — for a checkpoint that is only meaningful after a sign-in worked). Saving keeps your order, names and deletions; renamed steps appear as comments in the exported code, and both behaviour flags are stated there too, because an export that drops them is stricter than the run it came from.
- Android extras. A mobile session shows hardware Back and Home buttons, a Rotate button (portrait ↔ landscape — the stream and phone frame rotate with the device), and Device log (the most recent logcat lines, with refresh and copy).
- Save recording stores the flow as a reusable UI test; the left rail lists your saved tests with search, a platform badge, Run (with a per-step report), Run history (every past run, each opening its full report), code export, Create TCM case, and delete.
- If no matching runner is online, the page shows the exact commands to start one in a minute.
Edit a locator and debug a single step
When you edit a UI step’s actions in a test case, every action has a Match by choice for how to find the element: by visible text, role, Test ID (data-testid), form label, or raw CSS. You pick a strategy and type a value — Mockarty composes the locator for you, so you don’t hand-write selector syntax (existing selectors are kept as-is).
When a step fails you don’t have to re-run the whole case: fix the locator and click Test step — Mockarty replays just that step’s actions in the browser (a browser runner is required) and shows a per-action ✓/✗ verdict inline. Fix one locator, check it in place, then save the case.
Hotkeys: Ctrl+Enter starts the session, I refreshes the inspector, Ctrl+S saves the recording.
Runs on the server out of the box
The Mockarty server runs UI tests in-process on the lightweight engine — no separate runner to install. Press Run and the server replays the test itself (screenshots included, via the embedded rendering engine). Add an external runner only to offload the work (a busy server, or to run on a specific OS/browser); when one is online it takes the job automatically, otherwise the server handles it. Turn the in-process path off with MOCKARTY_UI_TESTS_INPROCESS=false to require an external runner.
Live sessions too. “Connect to a browser” — the interactive screen you click, type and record on — also runs on the server itself, so recording a test needs nothing installed either. The server opens that session on a real browser (a live picture needs a rendering engine) while replays stay on the lightweight one. When an external browser runner IS online it takes the session instead, so a busy server never becomes the bottleneck.
You need a runner (to offload, or for real Chromium)
UI tests execute on a runner that advertises the right capability — the server itself counts as one for the lightweight engine, or an external runner for offloading / a specific browser:
| Target | Capability |
|---|---|
| Web browser | ui-test |
| Android | mobile-android |
| iOS | not supported. The product offers web and Android targets; it ships no iOS driver and no iOS device lifecycle. An ios target is refused by name (ios_not_implemented, kept as the stable token) instead of running |
Start a runner pointed at your admin — one binary runs API, load and UI tests (UI on the lightweight engine, no Chromium install needed):
COORDINATOR_URL=http://localhost:5770 \
API_TOKEN=mki_your_runner_token \
RUNNER_NAME=ui-runner SHARED=true \
./mockarty-runner
It registers an extra ui-runner-ui runner with the ui-test capability. Set RUNNER_UI_TESTS=false to run API/load only.
For Android, start the mobile runner on a machine with adb and a running emulator or a connected device:
MOCKARTY_ADMIN_URL=http://localhost:5770 \
MOCKARTY_RUNNER_TOKEN=mki_your_runner_token \
RUNNER_NAME=android-runner RUNNER_PLATFORM=android RUNNER_SHARED=true \
./mockarty-mobile-runner
Lightweight engine — hundreds of parallel sessions, no Chromium
UI tests run on a lightweight engine pair by default instead of a full Chromium install. Navigation, clicks, form fills, waits and assertions run on a purpose-built headless core that uses a fraction of Chromium’s memory — a single runner holds hundreds of parallel sessions on a small machine. Steps that need pixels (screenshots, visual checks) are executed transparently on an embedded rendering engine, cookies included, so authenticated pages render correctly. Both engines download automatically on first use (pin RUNNER_LIGHTPANDA_PATH / RUNNER_SERVO_PATH on air-gapped hosts); your tests and reports don’t change.
When your suite depends on an exact Chrome, Firefox or WebKit build, set RUNNER_BROWSER_PROVIDER=local on a Playwright-capable runner — the lightweight engine is the default, real browsers are the opt-in.
Interactive sessions always get a real browser. When you connect to a browser from the studio — the live screen you click, type and record on — the runner opens that one session on a full browser even while the rest of your suite stays on the lightweight engine, because the lightweight core has no rendering pipeline and could not show you a picture. Nothing to configure; set RUNNER_LIVE_ENGINE=light if you would rather keep interactive sessions on the lightweight core too (element-inspector authoring, no video).
One runner, two modes — pick the engine per run
A single runner can serve both engines at once, each with its own thread budget. Set RUNNER_UI_ENGINES to a comma-separated list of engine[:threads]:
# 8 lightweight sessions (no Chromium) + 2 real Chrome, one binary
RUNNER_UI_ENGINES=lightweight:8,chromium:2 \
COORDINATOR_URL=http://localhost:5770 API_TOKEN=mki_… ./mockarty-runner
Each engine registers as its own runner card carrying an engine=<name> label (lightweight, chromium, firefox, webkit). When you run a test you choose which approach executes it with the engine field — the run is routed to a runner advertising that engine:
curl -s -X POST http://localhost:5770/api/v1/ui-tests/$UITEST_ID/run \
  -H "Authorization: Bearer $TOKEN" -d '{"engine": "chromium"}'   # real Chrome
curl -s -X POST http://localhost:5770/api/v1/ui-tests/$UITEST_ID/run \
  -H "Authorization: Bearer $TOKEN" -d '{"engine": "lightweight"}' # light engine
Leave engine unset and the run goes to any available UI runner. engine selects the runner approach; browser selects the browser within a real-browser runner. The Mockarty server itself always runs UI tests on the lightweight engine out of the box — add runners only to offload or to get real browsers.
Live sessions and recording work on the lightweight engine too. Start a session as usual — the studio shows an engine banner and adapts: the screen area is a render view (refreshed when the page changes) and the element inspector is the primary way to act — pick an element from the list (by its selector, label or text) and click/fill it; every action is recorded as the same replayable step a real-browser session produces, so a recording made here replays on any engine. Clicking directly on the render view also works (the click point is resolved to an element), but on pages with overlapping elements the inspector pick is the precise choice. A run video (the looping report animation) is available on either engine; a Playwright trace needs a real browser.
Run browser tests on a real phone
A paired Android phone can serve as a browser node: the companion app hosts offscreen WebViews and bridges their DevTools connection out to your Mockarty server, so a runner drives the phone’s own browser engine exactly like a headless desktop one — with screenshots rendered by the device itself, at real mobile DPI.
Turn on the browser bridge in the companion (the phone advertises the browser-cdp capability and its WebView version as a label while the bridge is up), then point a runner at the device:
RUNNER_BROWSER_PROVIDER=cdp \
RUNNER_CDP_ENDPOINT=ws://localhost:5770/api/v1/companion/cdp/<deviceId> \
COORDINATOR_URL=http://localhost:5770 API_TOKEN=mki_… ./mockarty-runner
GET /api/v1/companion/cdp-devices lists the phones currently offering a bridge in your namespace. One runner attaches to a device at a time (a second gets a clear “already attached” error), and devices in other namespaces are never visible. A phone uses its own paired device token and device ID to publish its bridge, activity, crash and load reports, poll its queues, and disconnect; a general runner token or another phone cannot act under that ID. That phone token cannot issue operator controls or installs. In a cluster, a temporary 503 means the shared device list could not be checked; retry instead of treating it as an empty list. The browser engine is the one installed on that phone, so pin a minimum WebView version in your selector when a test needs a specific feature.
When you disconnect on the phone, the companion tells the server it is leaving: its device card and its live-control session are retired at once instead of fading out after a timeout. A phone that vanishes without saying goodbye — battery pulled, app killed, signal lost — still ages out on its own, so a device can briefly appear in the list after it is already gone.
While mirroring a phone you can also listen to it: the audio button on the remote-control row asks the device to capture what it plays (media, assistant speech, app sounds — not the microphone) and streams it to the mirror, where it plays in your browser. Capture runs only while the button is on; switching it off, or leaving the device, stops it on the phone as well. A device that refuses the recording permission keeps mirroring video silently.
A job reaches the phone the moment you dispatch it. The companion keeps a request open on the server for each of its queues instead of asking on a timer, and the server answers it the instant a run, load, fuzz, install or remote-control command lands on that device — so a tap in live control and a dispatched run start without waiting for the next poll, and an idle phone sends a request only about every 25 seconds. If you poll a device’s queue yourself, the next endpoints (/api/v1/companion/live/<device>/run/next, …/load/next, …/fuzz/next, …/control/next) take ?wait=<seconds> (up to 25) and hold the request until something arrives; without it they answer at once, 204 when the queue is empty.
Hearing the device — live audio capture
The audio button in live control toggles on-demand capture on the phone. While it is on, the companion streams what the device plays (and records) to the server in small PCM chunks — POST /api/v1/companion/live/<device>/audio?rate=<hz>&ch=<n> with the raw bytes as the body. The server keeps a short recent window per device (a few megabytes, the oldest chunk drops first, so an overflow costs a tiny gap in the past, never a stall), and the live view reads it back with GET /api/v1/companion/live/<device>/audio — pass ?since=<seq> to fetch only chunks newer than the last one you saw (the sequence number comes back in the X-Audio-Next-Seq header; X-Audio-Rate / X-Audio-Channels carry the PCM format). An oversize push is refused with 413, and anything that is not PCM or an audio/* type with 415 — a dropped chunk is a gap, the stream never backs up. Turning capture off, stopping the live session, or the phone announcing its departure drops the buffered audio with the session.
The same pairing of audio and evidence shows up in run reports: a playAudio step carries the id of the clip it injected and a recordAudio step the id of the clip it captured, and GET /api/v1/companion/runs/<runId> resolves those ids into a clips manifest (name, type, byte size) so the report can offer playback right next to the step result; the clip bytes themselves are served by GET /api/v1/companion/clips/<clipId>.
A phone scenario can also turn the screen and sign in with a one-time code:
- rotate turns the display to
portraitorlandscape; the phone returns to its own rotation when the run ends, whether it passed or not. - sms waits (up to the step’s time, one minute by default) for a message with a code — optionally only from a sender whose name is in the step’s text — and keeps the code. The code is read from the message notification, so notifications must stay on; the report shows how many digits the code had, never the code itself.
- otp types the kept code into the field named in the step, or into the focused field. An
otpstep without an earliersmsstep fails and says so.
A phone without a SIM card, and an app version older than these steps, reports them as skipped with the reason.
For agents. An agent reads the same grid over MCP, with one tool per question: grid_scenario_reports lists device run reports (or one full report via runId) — the canonical reader for /companion/runs; grid_run_results covers load/fuzz outcomes. The rest of the fleet’s picture: companion_crashes_list (why a phone died — the watchdog uploads the last uncaught exception), companion_usage_list (per-device per-day occupancy and pass/fail rollup), and companion_clips_list (the voice-clip library playAudio/recordAudio work with). One endpoint, one tool — the run-report surface deliberately has no second name.
On a server behind an Ingress, the pairing address picker can show the panel’s
address as unverified. The server cannot safely probe an address supplied
by a browser request; scan the QR with the phone to confirm connectivity.
For a verified server-side check, configure MOCKARTY_PUBLIC_URL with the
operator-controlled public address. The address-check API accepts only that
configured address or this server’s own usable network interfaces.
Pairing a phone with the Desktop app
The Desktop app keeps its administration on this computer only, so out of the box a phone on your Wi-Fi cannot reach it. To pair one, open Desktop → Phone on this network, pick the network the phone is on and how long the window should stay open (15 minutes by default, up to an hour), and click Open pairing window. From that moment the QR on the UI Testing page points at the window: scan it on the phone and it pairs exactly as with a server. The window serves the phone-companion API and nothing else — administration stays unreachable from the network — and it closes by itself when the time is up (or when you click Turn pairing off). A phone that paired keeps its device token; it simply has no reach until you open the next window.
Until that window is open, the Desktop pairing page does not offer a phone QR;
it explains how to open the window instead. Do not make Desktop administration
public by changing its HTTP bind address just to pair a phone.
The runner registers itself and appears as online. Mint the mki_ runner token from your admin under Integrations (type: test runner). You can run several runners under one token — each runner process generates a unique instance ID at startup, so the admin keeps them as separate online runners (CI fleets and Kubernetes replicas can all share a single token).
Drive it with the AI agent
The autonomous path. Two specialists are available in the AI chat:
- Web UI Tester — drives Chromium / Firefox / WebKit.
- Mobile UI Tester — drives an Android device/emulator. iOS is not supported:
mobile-iosis not among the offered targets, no iOS device lifecycle ships (device providers are adb-family only), and aniostask is refused by name instead of failing at device acquisition.
Ask in plain language, for example:
Test
http://localhost:18999/: type “Alice” into the Username field, click Sign in, and assert the page shows “Welcome, Alice”. Save it as “Login flow”.
The agent checks that a runner is online, opens a session, inspects the screen, acts by meaning, adds your assertions, saves the recording, and reports which steps passed or failed. It can then run the saved test and read back the per-step results.
When the page misbehaves, the agent reads its console
If a click seems to do nothing, a form refuses to submit, or an area stays
blank, the agent can ask the page what it said — its console errors, warnings
and uncaught exceptions. The capture starts when the page opens, before its
first navigation, so a blocked script or a crash during boot is visible too,
even though it happened before anyone was watching.
You can ask for it directly:
Open
https://example.comand show me any console errors.
Repeated messages are folded together with a count, so a message firing in a
render loop reads as one problem rather than thousands. If the page is very
noisy the answer says how many entries were dropped, so nothing is quietly
presented as a clean log.
…and what it asked the network for
The other half of the same question. A screenshot of an empty list tells you
the list is empty; the 401 on the call that should have filled it tells you
why. The agent can read the page’s requests — method, URL, status — including
the ones that never completed at all: blocked by CORS, blocked as mixed
content, or a backend that simply is not running.
Open the dashboard and show me any failed requests.
Repeats fold together with a count, so a screen polling one endpoint reads as
one line rather than hundreds.
Finding one element instead of reading the page
On a real application, reading the whole screen returns hundreds of elements.
When you already know what you want, the agent can search for it instead:
Find the “Sign in” button and click it.
The search matches the visible label, the selector, the ARIA role and the tag,
and puts an exact label first — so “Save” does not come back with “Save as
draft” on top. If the query was too broad the answer says it was cut, rather
than quietly showing a slice.
Checking the screen is usable
The agent can audit the page for accessibility as it is right now:
Check this screen for accessibility problems.
It reports text whose contrast fails WCAG — including text that is effectively
invisible against its background — images with no alt, buttons and form fields
with no accessible name, and a page with no declared language. These are real
measurements from the rendered page, so a contrast regression that no
screenshot would reveal shows up plainly.
On top of those measurements the audit runs the full axe-core rule set —
the same engine behind Lighthouse — covering ARIA validity, landmarks,
document structure and dozens more WCAG checks. Its findings appear in the
same list as axe:<rule> entries with the usual severities
(critical / serious / moderate / minor), and the report’s axe section keeps
the engine version and per-rule detail with links to the fix guidance. If an
engine cannot run the axe pass, the report says so in axe.skipped — the
base measurements are always there either way.
Press the screen and see what breaks
The checks above answer “did the page render, and can it be used”. There is a
harder question: does what people press actually work. A product whose Save
button answers with an error renders perfectly, scores well on accessibility, and
passes every check that does not press anything.
The Press & check step does exactly that. It finds the forms and buttons on
the current screen and submits each form three ways:
- empty — the person who clicked before filling anything in;
- first list entry — often “not selected” with an empty value, and the most
common way to get a save that lands nowhere; - filled in — the happy path.
After each press it reads what the product answered and reports a failure when
that is an error page, a blank screen, or a bounce back to the sign-in form.
Every failure arrives with a one-line reproduction: where to stand, what to type,
what to press, and where it led.
What it never presses. Signing out, deleting and clearing, paying and
charging, sending an email or SMS, blocking and revoking access, publishing and
releasing. The rule lives in the engine rather than in the button, so it holds
however the step was added — from the interface, over the API, or by an agent.
The refusal is visible in the report: a control we deliberately left alone is not
a control that worked.
Add the step from the recorder toolbar, or describe it in the action list:
{ "type": "exercise", "extras": { "max": 6 } }
max bounds how many presses this screen gets (6 by default, 25 at most) — on a
dense admin page an unbounded step would consume the whole run. follow (0 by
default, 8 at most) tells the step to walk on through links to the same site and
press what it finds there too: a product is not the page you were given a link
to, and the broken button is often one click away from it.
The step also checks the way back. When a value it typed comes back on the page,
it opens the address again and looks for it: a save that showed as done and did
not survive a reopen is the defect a user meets the next morning and a check that
stops at the confirmation never sees. The reverse does not hold — if the value
does not come back, nothing is claimed, because the product may have moved on to
a list or shown a record number instead of the text.
On a phone, the same question, a different answer
A session on a real device answers the search the same way — ask for an
element and you get the few that match, ranked. On a phone the agent matches
the visible label first, then the content description (frequently the only
label an icon button has, and what a screen reader reads aloud), then the
resource id and the widget class.
Find the “Sign in” button on the phone and tap it.
The console, network and accessibility reads are browser measurements and a
device session says so plainly rather than returning an empty answer that
would read as “nothing to report”. For a device the equivalents are the
device log for messages, and reading the screen for its structure.
A step the phone’s runner has no implementation for — reading an SMS code and
changing the screen orientation today — is skipped with a reason, naming the
missing capability, and the rest of the scenario still runs. The run report shows
which step was skipped and why; the step is never reported as done, and never as an
anonymous failure.
Drive it with the API
Every step is a plain REST call — useful for CI/CD and scripting. The examples below use a bearer token; adjust localhost:5770 to your URL.
1. Confirm a runner is online
curl "http://localhost:5770/api/v1/runners?capability=ui-test" \
  -H "Authorization: Bearer $TOKEN"
2. Start a recording session
curl -X POST http://localhost:5770/api/v1/live-sessions \
  -H "Authorization: Bearer $TOKEN" -H 'Content-Type: application/json' \
  -d '{"platform":"web","browser":"chromium","startUrl":"http://localhost:18999/","record":true,"viewport":"800x600"}'
# → {"sessionId":"…","signalPath":"…","platform":"web","record":true}
3. Inspect the screen
curl -X POST http://localhost:5770/api/v1/live-sessions/$SID/inspect \
  -H "Authorization: Bearer $TOKEN" -d '{}'
# → {"elements":[{"selector":"#login","selectorKind":"id","text":"Sign in","x1":…,"clickable":true}, …]}
4. Act — fill a field, then click by meaning
# Fill the field at its coordinate
curl -X POST http://localhost:5770/api/v1/live-sessions/$SID/action \
  -H "Authorization: Bearer $TOKEN" -H 'Content-Type: application/json' \
  -d '{"action":"fill","x":76,"y":90,"value":"Alice","record":true}'

# Click an element by its text or selector
curl -X POST http://localhost:5770/api/v1/live-sessions/$SID/action \
  -H "Authorization: Bearer $TOKEN" -H 'Content-Type: application/json' \
  -d '{"action":"tap-element","match":"Sign in","record":true}'
5. Assert
curl -X POST http://localhost:5770/api/v1/live-sessions/$SID/action \
  -H "Authorization: Bearer $TOKEN" -H 'Content-Type: application/json' \
  -d '{"action":"assert","assert":"assertText","match":"#msg","value":"Welcome, Alice","record":true}'
# pass → {"action":{…}}   fail → {"error":"expected #msg to have text \"…\", got \"…\""}
6. Save the recording, then stop the session
curl -X POST http://localhost:5770/api/v1/live-sessions/$SID/save \
  -H "Authorization: Bearer $TOKEN" -d '{"name":"Login flow"}'
# → {"uiTestId":"…","name":"Login flow","actions":4}

curl -X DELETE http://localhost:5770/api/v1/live-sessions/$SID \
  -H "Authorization: Bearer $TOKEN"
7. Replay the saved test
A bare {} replays the recording exactly as captured — the test remembers the platform it was recorded on and, for mobile, the app it drove. Pass overrides (browser, viewport, platform, existingAppId, envVars, …) only when you want something different.
RUN=$(curl -s -X POST http://localhost:5770/api/v1/ui-tests/$UITEST_ID/run \
  -H "Authorization: Bearer $TOKEN" -d '{}')
# → {"taskId":"…","statusPath":"/api/v1/runner-tasks/…"}

# Poll for the per-step verdict
curl "http://localhost:5770/api/v1/runner-tasks/$TASK_ID" -H "Authorization: Bearer $TOKEN"
# resultData.extras.steps[] → each step's status, error (expected-vs-got), durationMs, healedWith
8. Export as code
curl "http://localhost:5770/api/v1/ui-tests/$UITEST_ID/export?format=playwright" \
  -H "Authorization: Bearer $TOKEN"
produces, for the flow above:
import { test, expect } from '@playwright/test';

test('Login flow', async ({ page }) => {
  await page.goto('http://localhost:18999/');
  await page.getByTestId('user').fill('Alice');
  await page.locator('#login').click();
  await expect(page.locator('#msg')).toContainText('Welcome, Alice');
});
Use format=appium for a mobile recording — you get an Appium (Python) test instead.
Watch the run back — video in the report
A browser test run records itself and attaches a short, looping animation of
the whole replay to its report — so you see exactly what happened, not just a
pass/fail per step. On by default for every web run (when the video
feature is configured on the server); interaction steps are stamped with a
click marker — a bright dot at the element the step pressed or filled —
so the animation reads as an annotated storyboard of the flow, paced slowly
enough to follow. Opt a single run out with recordVideo: false:
curl -s -X POST http://localhost:5770/api/v1/ui-tests/$UITEST_ID/run \
  -H "Authorization: Bearer $TOKEN" -d '{"recordVideo": false}'
The runner records the replay, turns it into a lightweight looping image, and
attaches it to the run report (open it from Run history on the saved-test
rail, or at /ui/runs/uitest/<runId>/report). The animation appears in the
report’s attachments next to the per-step screenshots.
This works on either engine. On a real-browser runner the whole replay is
captured as continuous video; on the lightweight engine the report animation is
built from the page as it was rendered at each step. Both open the same way in
the report — nothing to configure.
Notes:
- Web only. Mobile runs already stream live; video-of-run is for browser replays.
- On by default, opt-out per run — pass
recordVideo: falsefor a run
that shouldn’t record (recording adds a little overhead and storage). - Graceful when unavailable — and the report says why. If the runner can’t
produce or store the animation (noffmpegon the runner host, the file over
the size cap, the admin refusing the upload), the run still completes
normally and the report carries a short note in the video’s place —
run video (not stored).txtwith the reason — instead of a run that silently
has no video. The same note appears for a trace that could not be stored.
Time-travel trace — step through the whole run afterwards
For a deep dive when a run misbehaves, a browser test can record a full
trace of the replay — a per-step capture of the page (DOM snapshot,
network, console) you can step through after the fact. Tick Record trace on
the saved-test rail, or pass recordTrace: true when you run a web test:
curl -s -X POST http://localhost:5770/api/v1/ui-tests/$UITEST_ID/run \
  -H "Authorization: Bearer $TOKEN" -d '{"recordTrace": true}'
The run report attaches a trace.zip download (open it from Run history
on the saved-test rail, or at /ui/runs/uitest/<runId>/report). Download it and
open it locally:
playwright show-trace trace.zip
That opens the time-travel viewer: a timeline of every action with the page
state, network calls and console output captured at each step — ideal for
pinning down why a step failed.
Notes:
- Web only, real browser. Mobile runs stream live and aren’t traced this
way, and the lightweight engine doesn’t produce traces — run with a real
browser (RUNNER_BROWSER_PROVIDER=local) when you need one. - Opt-in & off by default — a trace adds storage, so you ask for it per run.
- Deep-dive, not the primary view. The per-step screenshots in the report
are the at-a-glance view; the trace is the detailed download for when you need
to step through everything. - Graceful when unavailable. If the runner can’t produce a trace, the run
still completes normally and the report simply has no trace.
Visual regression — catch what assertions miss
Assertions check the values you thought to check. Visual regression catches
everything else — a shifted button, a broken layout, a colour change, a missing
image — by comparing a screenshot of each step against a saved baseline.
Turn it on with visualMode when you run a web test (or tick Visual
regression in the saved-tests panel):
curl -s -X POST http://localhost:5770/api/v1/ui-tests/$UITEST_ID/run \
  -H "Authorization: Bearer $TOKEN" -d '{"visualMode": "warn"}'
How it works:
- First run captures a screenshot per step and saves it as the baseline
(the expected look). Nothing to compare against yet. - Every later run compares its screenshots to the baseline. The report shows,
per step, the expected (baseline), the actual, and a diff image with
the changed pixels highlighted — plus the divergence percentage. warn(default) — divergences are flagged in the report but the run does
not fail. Scan the whole flow visually and decide what matters — this is
the hours-of-manual-checking saver.failturns an over-threshold step into
a failure (a CI gate).offdisables it.- A run-level summary (compared / diverged / new baselines) sits in the report’s
Environment panel.
Per-step checkpoints — when you don’t want to screenshot every step, add a
Visual checkpoint only on the screens that matter, alongside your assertions.
In the steps panel click Visual checkpoint and name the screen (e.g. “Cart
page”); the checkpoint validates that screen’s screenshot against a baseline keyed
by its name (so inserting steps before it never shifts which baseline it uses). It
runs even when the run-level visual mode is off, so you can visual-check exactly
the critical states — the first run records the baseline, later runs diff against
it, and the per-step verdict (match / diff / new baseline) plus an Approve
baseline button show right in the run report. A checkpoint exports as
await expect(page).toHaveScreenshot('Cart page.png') in the Playwright code.
Because the baseline is the documented expected behaviour, the expected / actual
/ diff images show inside the TCM test case run, not only in the standalone
report — so a reviewer sees the visual truth next to the steps and assertions.
When the object store that keeps the baselines is unreachable, the run says so
instead of failing silently: the screenshot upload answers 503 with the
object_store_unavailable code and the underlying reason, and the run report
carries a note (“visual baseline store unavailable — the step ran, its screenshot
was not kept: …”) next to the artifacts. The steps still ran; once the store is
back, re-run to collect the visual evidence.
Tuning:
visualThreshold(0..1, e.g.0.01= 1%) sets how much a step may differ when
a new baseline is established. An existing baseline keeps its own threshold.- Each browser + viewport gets its own baseline automatically — a Chromium
1280×800 run never compares against a Firefox 390×844 baseline. - Ignore regions — when part of a page is inherently dynamic (a clock, an ad
slot, a randomised id), mask it so it never trips the diff. Open the baseline
manager, click Masks, drag rectangles over the regions to ignore, and Save —
those areas are excluded from every later comparison. - Needs an object-store backend configured. The link-signing secret is managed
automatically, so visual regression (like run traces and run videos) works as
soon as storage is set up — no extra secret to wire. To bring your own key or
rotate it, setMOCKARTY_UITEST_VISUAL_SECRET(in a cluster, use the same
value on every node).
Managing baselines:
In the UI Testing page, each saved test has a Screenshot baselines button: it opens a manager showing every baseline (a thumbnail per browser / viewport / device / step) with its status — Active, Pending (awaiting your approval) or Superseded. After an intended UI change, click Accept as truth on the new capture to promote it (the old one is superseded); Delete drops a stale baseline so the next run re-establishes a fresh one. An AI agent does the same with the ui_visual_baselines_list / ui_visual_baseline_approve / ui_visual_baseline_delete tools.
Deleting a saved UI test also closes its visual baselines. Their image files are reclaimed after no active baseline references them; deleting one baseline never removes an image still used by another.
A design mockup as the baseline (agent-friendly). Instead of a capture from a
previous run, a checkpoint can be judged against an uploaded design mockup: the
run then asks “does the render match the intended design?” rather than “did it
change?”. In the baseline manager use Upload mockup, or — for an AI agent —
call ui_visual_baseline_mockup_b64 with the image base64-encoded in the JSON
body (uiTestId, stepKey, imageBase64, optional browser/viewport/device).
Leave browser/viewport/device empty unless the run pins them, otherwise the
mockup lands under a different key and the run records a fresh baseline instead.
The equivalent REST call is POST /api/v1/ui-visual/baselines/mockup-64.
Over the API:
# List the baselines for a test
curl "http://localhost:5770/api/v1/ui-visual/baselines?uiTestId=$UITEST_ID" -H "Authorization: Bearer $TOKEN"
# Accept a captured screenshot as the new baseline (after an intended UI change)
curl -X POST "http://localhost:5770/api/v1/ui-visual/baselines/$BASELINE_ID/approve" -H "Authorization: Bearer $TOKEN"
Visual assess — an AI design review, no baseline needed
The visual checkpoint above needs a saved baseline to compare against. Visual
assess doesn’t: add a step of type Visual assess (the sparkle icon in the
steps toolbar) and, on the next run, a vision model reviews that screen’s
screenshot the way a senior product designer would — layout and alignment,
clipped or overlapping content, colour consistency and contrast, typography,
spacing and visual hierarchy, and outright broken UI (unstyled elements,
missing icons/images). It’s the right tool for a first-time design QA pass, or
any screen where you don’t yet have — or don’t want to maintain — a reference
screenshot.
The step attaches a 0-100 score, a verdict (good / acceptable /
poor), and itemised findings (severity + what’s wrong) to the report.
Optionally give it a review prompt when adding the step (e.g. “check this
matches our brand colours”) to focus the review on a specific design brief for
that screen; leave it blank to use the built-in design-quality checklist.
Visual assess needs an admin vision-capable LLM profile configured (Settings
→ AI/LLM → tick “Supports visual” on a multimodal profile). Without one the step
still runs and captures its screenshot; the report then shows
visualAssess.notEvaluated with the reason instead of a score. That
distinction matters: a design section with no complaints means the reviewer
looked and liked the screen, while this line means nobody looked at all. The
rest of the run is unaffected either way.
Mockarty checks the profile rather than trusting the tick: it sends one tiny
test image and keeps the first profile that actually accepts it. A model
advertised as multimodal whose API rejects images is skipped automatically, so
you never get a run that silently fell back to nothing.
Reviewing a screen while you drive it
You don’t have to save a test and run it to get an opinion. While a live session
is open — yours or an agent’s — you can ask for the same review of the screen as
it stands right now:
curl -X POST "http://localhost:5770/api/v1/live-sessions/$SESSION_ID/visual-review" \
  -H "Authorization: Bearer $TOKEN" \
  -H "Content-Type: application/json" \
  -d '{"prompt": "check this against our brand palette", "record": true}'
{
  "report": {
    "score": 62,
    "verdict": "acceptable",
    "summary": "The form is usable but its labels sit too close to the inputs.",
    "findings": [
      {"severity": "medium", "title": "Cramped label spacing", "detail": "Labels touch the fields below them across the form."}
    ]
  },
  "recorded": 7
}
Both fields of the body are optional. prompt replaces the default checklist
with your own brief; record: true also stores the review as a Visual
assess step in the recording, so the test you save from this session
re-reviews the screen on every future run. The same call is available to AI
agents as the ui_session_visual_review tool, and it works on a phone screen as
well as a browser page.
Browser console in every report
Every browser run records the page’s console warnings and errors automatically —
no flag to set. This is where the failures that no selector can see announce
themselves: a script blocked by Content-Security-Policy, an uncaught exception
during page load, a failed dynamic import that left the page half-alive.
In the run report:
- the header shows
console.errorsandconsole.warningscounters, so a
run with a noisy console is visible at a glance; - the run node carries a
console.txtattachment with the messages rendered
the way devtools shows them — level, repetition count, the step during which
the message fired, and the source location:
ERROR ×3: Refused to load the script 'https://app/main.js' (CSP)
    at https://app/:1:1
WARNING [step 4]: Deprecated API usage: ...
Notes:
- Warnings and errors only.
console.log/info/debugoutput is not
recorded — it is the page talking to its developers, not failing. - Repeats collapse. A message firing thousands of times (a render loop) is
stored once with its count — the report stays readable and the count itself
tells the story. - Bounded. At most 50 distinct messages per run; past that the report says
how many more were discarded.
Failure triage — which tests are burning you and why
When a suite runs on a schedule, the question stops being “did this run pass”
and becomes “which tests keep failing, which are flaky, and what usually breaks
them”. The Failure triage button on the saved-tests rail answers exactly
that from your run history:
- Fail % — the share of finished runs that failed or broke.
- Flake % — how often consecutive runs flip between pass and fail. A high
flake score with a moderate fail rate means an unstable test (retry, then fix
the selector/wait); 0% flake with failures means the test is consistently
broken — something real changed. - Top error — the dominant error class across the failures, so ten
identicalSelectorNotFoundruns read as one problem, not ten. - Evidence — whether the latest failure recorded a trace and/or video, so
you know before opening the report that there’s something to watch.
Tests are sorted worst-first. The same report is available over the API —
GET /api/v1/ui-tests/triage?windowDays=30 — and to AI agents via the
ui_test_failure_triage MCP tool, so an agent can decide “flake → retry”
versus “real break → investigate” on its own.
Web performance — how fast the page loads
Functional pass/fail tells you the page works. Web performance tells you how it feels — how fast it paints, how stable the layout is, how much it downloads. Mockarty reads the page’s real load metrics from the browser and rates them against the public Web Vitals thresholds.
Captured per measured page:
- LCP (Largest Contentful Paint) — when the main content appears.
- CLS (Cumulative Layout Shift) — how much the layout jumps while loading.
- TTFB (Time To First Byte) — backend + network latency to the first byte.
- FCP (First Contentful Paint), DOMContentLoaded, Load time.
- Requests and total transfer size, with a per-type breakdown.
Each metric is rated good / needs-improvement / poor (web.dev thresholds), and the report shows an overall rating. It is informational — a slow page is reported, never failed.
On a test case step. Tick Measure web performance on a UI-test step in the case builder. After the step replays, the page’s metrics are measured and the run report shows them as a performance card on that step plus a downloadable performance.json.
As a one-shot measurement. Measure any page in a single call:
curl -s -X POST http://localhost:5770/api/v1/ui-tests/measure-perf \
  -H "Authorization: Bearer $TOKEN" \
  -d '{"url": "https://app.example.com/dashboard", "waitForSelector": "#main"}'
This returns a taskId; poll /api/v1/runner-tasks/<taskId> — the Web-Vitals summary is on the measured step (resultData.extras.steps[].perfMetrics). Use storageStateId to measure a page behind login, and waitForSelector to let the page settle before measuring.
Notes:
- Web only. Needs a browser runner online (capability
ui-test). - Informational. It never fails a step or run — it surfaces the numbers so you decide.
Network mocking — run the UI against a mocked backend
Drive the real frontend while its backend calls are intercepted — mock, block, stub or delay them. This is the thing no other tool does in one place: a UI test and a mock of the same backend, together. Test the frontend in isolation, simulate an outage, force an error response, or inject latency — without touching the real backend.
Per matching request you choose an action:
- Mock (redirect) — point the request at a Mockarty stub of the same backend (
redirectUrl). Your UI runs against mocks you already authored. - Block — abort the request (simulate a dead dependency / offline mode).
- Stub — answer the request locally with a status, headers and body (no network) — a quick canned response.
- Delay — let the request through after N milliseconds (latency injection).
A rule matches by URL pattern: a glob like **/api/** or a regex in /…/ form. Rules are installed before the first navigation, so even the page’s initial data loads hit them.
On a test case step. Click Network mocking on a UI-test step in the case builder and add rules (pattern → action → param). The run report shows an interception summary (how many requests were mocked / blocked / stubbed / delayed).
Over the API / from an agent. Pass networkRules when you run a test:
curl -s -X POST http://localhost:5770/api/v1/ui-tests/$UITEST_ID/run \
  -H "Authorization: Bearer $TOKEN" -H "Content-Type: application/json" \
  -d '{"networkRules": [
        {"urlPattern": "**/api/orders", "action": "mock", "redirectUrl": "http://localhost:5770/stubs/myns/orders"},
        {"urlPattern": "**/api/health", "action": "block"},
        {"urlPattern": "**/api/slow", "action": "delay", "delayMs": 2000},
        {"urlPattern": "**/api/flags", "action": "stub", "status": 200, "body": "{\"beta\":true}"}
      ]}'
Notes:
- On an Android phone the same rules apply to the phone’s plain-HTTP requests. HTTPS requests pass through untouched unless you start a live session with Decrypt HTTPS (MITM) — the phone then asks to trust a per-run certificate; apps that pin their certificate still bypass the rules.
- Informational summary. Rules never fail a step; a bad pattern is skipped. Your assertions still decide pass/fail.
Capture a phone’s network traffic — and keep it private
On an Android phone, tick Traffic before a run or a live session: the phone’s requests are routed through Mockarty for the run, and the report lists what the app asked for — method, address, status and sizes. HTTPS requests show the host only, unless the session decrypts HTTPS.
Credentials in the address are replaced with REDACTED before anything is stored: values of parameters such as token, api_key or password, a user name with password, and path parts that follow a name like /token/ or look like a token, a JWT, an e-mail or a card number. A secret with no such name or shape (a bare hex string looks like any id) is not recognised — keep secrets out of addresses.
Traffic privacy (the shield button next to Traffic) sets two rules for the whole namespace:
- Runs may capture device traffic. Switch it off and no run in the namespace captures traffic, whatever the run asks — the Traffic option is greyed out and says why. Network rules still apply; nothing is recorded.
- Clear captured traffic after N days (0–365). Captured traffic older than that is cleared from reports; the run, its steps and its verdict stay. 0 keeps the traffic as long as the run.
Changing the policy needs write rights on the namespace. An AI agent reads and changes it with the ui_traffic_policy_get and ui_traffic_policy_set tools; a script uses the same endpoint:
curl -s -X PUT "http://localhost:5770/api/v1/ui-tests/traffic-policy?namespace=myns" \
  -H "Authorization: Bearer $TOKEN" -H "Content-Type: application/json" \
  -d '{"captureEnabled": false, "retentionDays": 30}'
Send only what changes — an omitted field keeps its value.
Run UI tests inside a Test Plan
A saved recording can run as a Test Plan item — alongside functional, load,
fuzz and TCM-case items — so one plan covers your whole suite. Add an item of
type UI test in the plan builder and pick the recording; the plan run
dispatches it to a browser/mobile runner, waits for it, and shows the result in
the plan report next to everything else.
Over the API, a plan item is {"type": "ui_test", "refId": "<ui-test-id>"}; an
agent adds one with the create_test_plan MCP tool (item type ui_test). UI
tests are part of the api-tester seat — the same one that owns the recorder
and the runner.
Sign in once, reuse it for every run
Logging in on every run is slow, and it falls apart entirely when the login needs a one-time SMS code you can only enter by hand. Instead, sign in once and save that authenticated browser state — cookies and localStorage — then start every later session or test run already logged in.
In the UI Testing page (web sessions), the toolbar has a Save sign-in button: log in inside the live session, click it, give the state a name. The launcher then offers a Sign-in state picker — pick a saved state and the browser opens past the login screen. Your recordings stay focused on the feature under test; they don’t have to replay the login.
Saved states contain browser cookies and local storage. Administrators can enable encryption at rest by configuring MOCKARTY_PII_ENCRYPTION_KEY before starting the nodes. All nodes sharing a database must use the same key; a node without the key cannot read encrypted states and refuses the requested authenticated start. Existing unencrypted states remain readable.
Over the API it’s two endpoints:
# After logging in inside a live session, capture its authenticated state
curl -X POST "http://localhost:5770/api/v1/live-sessions/$SESSION_ID/save-state" \
  -H "Authorization: Bearer $TOKEN" -H 'Content-Type: application/json' \
  -d '{"name":"acme-prod-login"}'
# → {"id":"…","name":"acme-prod-login","platform":"web"}

# List your saved states (bodies are never returned — only metadata)
curl "http://localhost:5770/api/v1/ui-storage-states" -H "Authorization: Bearer $TOKEN"

# Start a NEW session — or a test run — already logged in
curl -X POST "http://localhost:5770/api/v1/live-sessions" \
  -H "Authorization: Bearer $TOKEN" -H 'Content-Type: application/json' \
  -d '{"platform":"web","startUrl":"https://app.acme.test/dashboard","storageStateId":"…"}'
The AI agent does the same on its own: it calls ui_storage_states_list before testing an authenticated site, reuses a saved sign-in when one exists, and saves a fresh one (ui_session_save_state) the first time it has to log in — so subsequent runs skip the login entirely for as long as the credentials stay valid.
A storageStateId you name is honoured or refused, never quietly dropped: if the state is unknown, deleted, or belongs to another namespace, the request answers 400 with saved sign-in state "…" not found or expired instead of starting a logged-out browser that fails far from the cause. Omit the field to start fresh on purpose. This holds for a saved test run, a live session, and a step-debug replay. A saved sign-in state is a browser thing: naming one for an Android or iOS run, session or test-case step is refused with the same 400, because the mobile engines never read it — sign a mobile run in with deviceLeaseId (a warm, already-logged-in device) or snapshotId (restored app data) instead.
If the state cannot be read, including after a key mismatch, the authenticated start is refused as temporarily unavailable. Listing and deletion also return a server error on storage failure; a missing state returns 404 on deletion.
Reading a page as content
A live session can return the current page as content, not just an element tree — one call instead of screenshots or crawling elements. Pass mode to the inspect endpoint (or to the ui_session_inspect agent tool):
text— the page as clean plain text;markdown— headings, lists, emphasis, code blocks and links converted to markdown (best for reading an article or docs page);outline— the heading tree plus a summary of forms and landmarks (the fastest first look at an unknown page);links— every visible link as{text, href}with absolute URLs (pick where to navigate next);elements(default) — the classic interactive element tree.
curl -X POST "http://localhost:5770/api/v1/live-sessions/{sessionId}/inspect" \
  -H "Authorization: Bearer $TOKEN" -H 'Content-Type: application/json' \
  -d '{"mode":"markdown"}'
The extraction never depends on page layout, so the lightweight engine returns the same content a real browser would — reading pages at scale works on the default engine with no Chromium involved.
Saved states live in your namespace and are reusable until the underlying session expires on the target site. Delete one with DELETE /api/v1/ui-storage-states/{id} when it’s stale.
On mobile: hold a logged-in device
Native apps don’t have a browser storage state, and the login often needs a one-time SMS code. So on mobile the same idea takes a different shape: hold a logged-in device. You sign in once on a real device or emulator, and that device is kept reserved — later runs reuse it already authenticated, with no re-install and no second SMS. This works on any device, including non-rooted ones and device farms.
On the UI Testing page, switch to the Android platform (iOS is not supported and is not offered as a target), pick the app, and press Hold device. Once the device is ready, start a session on it and log in once. After that, the launcher’s Logged-in device picker offers that lease — pick it and the session (or a test run) opens straight into the authenticated app.
Over the API:
# Hold a device for an app (picks an online mobile runner)
curl -X POST "http://localhost:5770/api/v1/ui-device-leases" \
  -H "Authorization: Bearer $TOKEN" -H 'Content-Type: application/json' \
  -d '{"name":"acme-android-login","platform":"android","existingAppId":"com.acme.app"}'
# → {"lease":{"id":"…","status":"pending"},"holdTaskId":"…"}
# Poll the hold task, then list leases until this lease is active before logging in.

# Reuse the logged-in device — a session or a run starts authenticated
curl -X POST "http://localhost:5770/api/v1/live-sessions" \
  -H "Authorization: Bearer $TOKEN" -H 'Content-Type: application/json' \
  -d '{"platform":"android","deviceLeaseId":"…"}'

# Release it when you're done
curl -X DELETE "http://localhost:5770/api/v1/ui-device-leases/{id}" -H "Authorization: Bearer $TOKEN"
The AI agent drives this with ui_device_leases_list, ui_device_lease_hold, and ui_device_lease_release, reusing a held device by passing deviceLeaseId to ui_session_start / ui_test_run.
A new lease is pending while the runner acquires and launches the device. The lease list changes it to active only after a successful hold result includes the held device; then it can be selected for a session or test run. A failed hold becomes error. A pending lease reserves capacity but cannot be reused yet. If the server restarts between completion and the status update, listing the lease checks the saved hold result and restores the correct status.
Naming a pending lease in a session or run returns 409 and asks you to wait for its existing hold task. Naming an error or expired lease returns 400 and requires a new hold.
A deviceLeaseId you name is honoured or refused, never quietly downgraded: if the lease is unknown, expired, or belongs to another namespace, the request answers 400 with device lease "…" not found or expired instead of silently running on a cold, logged-out device. Omit the field when a cold device is what you want. ui_device_snapshot_capture follows the same rule. If the lease registry itself cannot be reached, the answer is 503 with device lease "…" could not be checked — the lease is still yours; retry rather than holding a new device.
Creating a new lease returns 409 if another request has already reserved the last ready device, including when requests arrive through different server nodes. Release a lease or attach another device before retrying. It returns 503 with device lease capacity temporarily unavailable if the server cannot check or reserve capacity; no new hold is dispatched on that response.
The optional ttlHours accepts 0–8760 hours; 0 uses the default 30 days.
On a rooted device: save the signed-in state and restore it anywhere
Holding a device keeps one device reserved. If instead you want a portable signed-in state — capture it once and restore it onto any fresh device before a run — use a device snapshot. A snapshot saves the app’s on-device data (its login session, tokens, preferences) as a reusable file. Before a test run you restore it, and the app opens already authenticated, even on a device that has never seen this app.
Snapshots need a rooted or developer (userdebug) device/emulator, or a debuggable build of the app — they read the app’s private data directory, which production devices lock down. On locked devices use Hold device (above) instead. The feature is enabled by your administrator (it needs object storage configured).
# Capture the current signed-in state of an app (runs on a snapshot-capable runner)
curl -X POST "http://localhost:5770/api/v1/ui-device-snapshots" \
  -H "Authorization: Bearer $TOKEN" -H 'Content-Type: application/json' \
  -d '{"name":"acme-android-loggedin","existingAppId":"com.acme.app"}'
# → {"snapshot":{"id":"…","hasBlob":false},"captureTaskId":"…"}  (poll the task; hasBlob becomes true when stored)

# List your snapshots
curl "http://localhost:5770/api/v1/ui-device-snapshots" -H "Authorization: Bearer $TOKEN"

# Run a test that restores the snapshot first — the app starts logged in
curl -X POST "http://localhost:5770/api/v1/ui-tests/{testId}/run" \
  -H "Authorization: Bearer $TOKEN" -H 'Content-Type: application/json' \
  -d '{"platform":"android","existingAppId":"com.acme.app","snapshotId":"…"}'

# Delete a snapshot when you no longer need it
curl -X DELETE "http://localhost:5770/api/v1/ui-device-snapshots/{id}" -H "Authorization: Bearer $TOKEN"
Use a held device for a single always-on logged-in device that anyone can drive; use a snapshot when you want to spin up many fresh devices that all start from the same signed-in state.
A snapshotId you name is honoured or refused, never quietly dropped: if the snapshot is unknown, deleted, belongs to another namespace, or has no captured data yet (a capture still running leaves exactly that), the run answers 400 with device snapshot "..." is not usable instead of starting an unprepared device. A node whose snapshot transfer is not configured answers 503 (could not be checked) — that is the platform’s state, so retry rather than capturing again. Omit the field for a run that wants no snapshot.
Snapshots are kept until you delete them by default — they are valuable signed-in states. If your environment needs age-based cleanup, an administrator can set a TTL via the MOCKARTY_DEVICE_SNAPSHOT_RETENTION environment variable (e.g. 720h for 30 days); a background sweeper (leader-only in a cluster) then closes snapshots older than that. The shared storage cleanup removes a tar after confirming that no live snapshot or other resource still uses it. Without the variable, automatic snapshot expiry is off.
Selectors
When you inspect, each element comes with the most stable selector available, chosen in this order:
id → data-testid → aria-label → placeholder → visible text → alt → title → CSS path.
You act on an element by passing its selector or text as match. Recordings keep an alternate-selector chain, so when a replay can’t find an element by its primary selector it automatically tries the alternates and the run keeps going — the result marks which selector healed, so you know the recording wants a refresh.
Assertions
| Verb | Checks |
|---|---|
assertVisible / assertHidden |
the element is / isn’t visible |
assertText |
the element contains the expected text |
assertValue |
an input’s value equals the expected value |
assertEnabled / assertDisabled |
the element is enabled / disabled |
assertChecked / assertUnchecked |
a checkbox/radio is checked / unchecked |
assertCount |
the selector matches the expected number of elements |
assertAttribute |
an attribute equals the expected value |
assertURL / assertTitle |
the page URL / title contains the expected text |
Mobile assertions cover assertVisible, assertHidden, assertText, and assertSMS (wait for a one-time code to arrive).
A failed assertion reports the expected-versus-actual value, both in the live session and in the per-step replay result.
Engines, browsers and viewport
A web run executes on the engine you picked: the lightweight one (no Chromium install) or a real browser — Chromium, Firefox, WebKit. In the UI that is the Engine row; over the API it is the engine field on session start, on a test run, and on a step debug. Empty = any available runner.
Ask the server what is available to you:
curl -s http://localhost:5770/api/v1/ui-tests/engines -H "Authorization: Bearer $TOKEN"
# → {"engines":[{"engine":"lightweight","name":"Lightweight","runners":1,"canRender":true,"local":true}],"default":""}
runners is how many runners offer that engine, canRender whether screenshots and visual comparisons work on it, and local means the Mockarty server serves it itself — no separate runner needed. Asking for an engine that is not in the answer is pointless: nobody can execute that run.
Live screen on each engine. canRender answers “does this engine produce pictures” — screenshots, visual comparisons and run video work on Chromium, Firefox and WebKit. The live mirror of a session differs by engine: Chromium streams smooth video; Firefox and WebKit show a series of snapshots — about two a second, and only when the page changes — and the viewer says so in a banner. You drive the session, record steps and get screenshots the same way on all three. For smooth video pick Chromium (the lightweight engine also switches to Chromium for a live session).
This notice also appears when you leave Engine on Auto and the selected runner uses Firefox or WebKit as its default browser. The same limit applies when watching a saved test replay live; the replay still completes and its screenshots remain available in the report.
The list builds itself. Both the server and the runner advertise what they can actually run: the lightweight engine is always there (it needs no browser installed), real browsers are the ones actually installed. Nothing to configure.
To offer LESS than that, set a restriction on the server or the runner — RUNNER_UI_ENGINES=lightweight,chromium. It filters what was detected: an engine the machine does not have will not appear, even when it is named there.
A real-browser engine sets browser for you, so you only pass browser when you want to name the browser inside the runner explicitly. Set the window size with viewport ("WIDTHxHEIGHT"), and seed an already-logged-in state with a saved cookie/localStorage bundle so a flow starts past the login screen.
See also
- UI Test Recording — capturing flows with the browser extension
- Traffic Recorder — recording API traffic